ScienceNot yet confirmed elsewhere1 publisher3 min readPublished
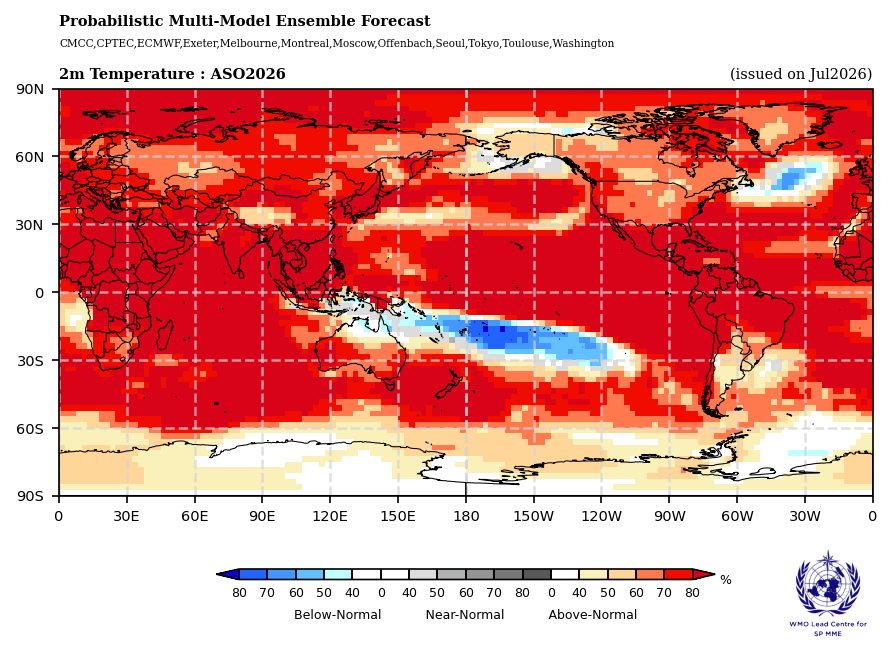
A 4C Pacific anomaly with a date on it: what the record El Nino gives operators to plan against
The Met Office will commit to the sign of the disruption, not its address. The rice loss is already booked to a marketing year that begins after the event ends.
The Scientist · Science desk
What happened
- The El Nino now under way is projected to peak at the end of this year with east-central Pacific sea surface temperatures 4C above normal, 60 per cent above the old record.
- Thousands of square kilometres of Borneo are burning, with peatlands releasing carbon dioxide.
- The same pattern raises wind shear over the Atlantic, cutting the odds of hurricanes reaching North America in summer and autumn.
Why it matters
- constraint Cover written to the duration of the event runs out before the loss is priced: the peak is this year, the quantified rice shortfall is booked to 2026-27.
- decision Procurement and routing choices have to be made on the sign of the anomaly rather than its address, because the Met Office is explicit that it cannot rank the worst-hit regions.
- precedent Scaling from 1982-83 or 2015-16 sets a floor, not an estimate, since this event sits on decades of accumulated ocean warming.
Percentages hide their own arithmetic. Run the 60 per cent backwards: if the projected peak of 4C above normal is 60 per cent above the previous record anomaly, that old record sat near 2.5C, and the extra 1.5C is the part with nothing to calibrate against [8][16][17].
Nick Dunstone of the UK Met Office says the size-to-impact relationship is "fairly linear" across most regions, while conceding it is hard to know which regions get hit worst [9]. Taken together those two statements define the planning problem: the magnitude scales, the address does not resolve. On the linearity Dunstone describes, impacts would run roughly 60 per cent above those of the strongest previously recorded event [19].
What the Met Office will put its name to is direction. Dry over the Amazon, Borneo, Indonesia and Australia for the next few months as the descending arm of the Walker circulation moves onto them [10][1], with wildfire risk in those same places "greatly increased", per Dunstone [11]. Dry in Central America, where several major coffee producers sit, and dry across India [4]. Wetter than usual in Paraguay, Uruguay and southern Brazil, where the 2015-16 event displaced more than 100,000 people [13]. Wetter and stormier in the UK and parts of the US [5].
The rice figure carries a date worth reading twice. The anomaly peaks at the end of this year [8]. The 9 million tonne fall in global production that analysts expect is attributed to 2026-27 [18]. India's monsoon is the weakest since 2009, with rainfall tracking about 15 per cent below average in a country where rain supplies 60 per cent of agricultural land [12]. So the meteorology, the harvest and the price all land in different accounting periods, and a hedge or a freight commitment written to the life of the El Nino expires before the shortfall is priced.
For insurers the ledger moves in two directions at once. El Nino intensifies upper-level westerlies, and the resulting wind shear tears at forming tropical storms, which lowers the odds of hurricanes reaching North America in summer and autumn [6]. That relief is in Atlantic property wind. The additions are drought, wildfire and inland flood, in other territories and other lines.
The reason historical analogues should be treated as a floor rather than a forecast is stated plainly by Samantha Burgess of the EU's Copernicus Climate Change Service: El Nino is adding heat on top of decades of human-driven warming [15]. The evidence is in the calendar. Global average sea surface temperature set a record on 26 August, which is odd because the global ocean is normally warmest in March or April, after the austral summer [14]. The event is already the strongest on record on some measures [7]. During the 1982-83 super El Nino, the Great Fire of Borneo took out 36,000 square kilometres of rainforest [2]; thousands of square kilometres of Borneo are burning again, with peat releasing carbon dioxide [3].
What to watch
- Whether the peak anomaly verifies near 4C as forecasts update through the end of the year, or the event tops out lower.
- Whether the 9 million tonne rice shortfall for 2026-27 is revised as Indian and other harvest data arrive.
- Whether burned area in Borneo and Indonesia approaches the 36,000 square kilometres of the 1982-83 event.
Clarity's read
What the record supports and how the coverage leans. The claims behind it follow.
Reality
- Evidence61
- Adoption47
- Hype gap+16
- Incentives34
- Confidence56
Claim ledger
Ranked by verification strength, evidence, and original report placement.
- [1]
The Met Office is forecasting dry conditions over the next few months in South America, South-East Asia and Australia.
- [2]
During the 1982-83 super El Nino, the "Great Fire of Borneo" destroyed 36,000 square kilometres of rainforest.
- [3]
Thousands of square kilometres of Borneo are burning again, with peatlands releasing large amounts of carbon dioxide.
- [4]
The Met Office is forecasting dry conditions in Central America, home to several major coffee producers, and in India, the world's largest rice exporter.
- [5]
The UK and parts of the US are also likely to experience wetter, stormier weather.
- [6]
El Nino reduces the likelihood of hurricanes hitting North America in summer and autumn, because it often intensifies high-level westerly winds and the resulting wind shear disrupts storm formation.
- [7]
The El Nino climate phase that has begun in the Pacific is already the strongest on record on some measures.
- [8]
When it peaks at the end of this year, sea surface temperatures in the east-central Pacific are projected to reach 4C above normal, a 60 per cent increase over the old record.
- [9]
Nick Dunstone of the UK Met Office: "If you ramp up the size of your El Nino, you tend to ramp up the impacts in most regions of the world. It's hard to know exactly which regions are going to be impacted the worst, but in general it's fairly linear."
- [10]
El Nino forms when trade winds weaken and the western Pacific warm pool runs back eastward, shifting the centre of rising moist air and the whole Walker circulation eastward, so warm dry air descends over South America and over South-East Asia and Australia.
- [11]
Dunstone names the Amazon, Borneo, places in Indonesia and Australia as regions where wildfire risk would be greatly increased.
- [12]
India is experiencing its weakest monsoon since 2009; rainfall, the water source for 60 per cent of the country's agricultural areas, is on track to be 15 per cent below average.
- [13]
Paraguay, Uruguay and southern Brazil are forecast to have more rain than usual; during the 2015-16 super El Nino, more than 100,000 people were displaced by flooding in these areas.
- [14]
On 26 August global average sea surface temperature reached a new record, unusual because it came in August rather than March or April, when the global ocean is normally warmest after the austral summer.
- [15]
Samantha Burgess of the EU's Copernicus Climate Change Service said El Nino is adding heat to the system, but doing so on top of decades of human-driven warming.
- [16]
The previous record east-central Pacific sea surface temperature anomaly implied by the projection was about 2.5C above normal.
- [17]
The projected peak exceeds the previous record anomaly by about 1.5C.
- [18]
Analysts expect global rice production to fall by 9 million tonnes in 2026-27, raising prices on a staple half the world's population relies on.
- [19]
Applying the roughly linear size-to-impact relationship Dunstone describes, impacts would run about 60 per cent above those of the strongest previously recorded El Nino.
Sources
1 independent publisher whose own reporting we read for this story.
- newscientist.com5 graphs that show how the record-breaking El Niño will affect the world
1 article · August 26, 2026
Topics and entities
Follow any of these and your For You feed starts watching them — no settings page required.
Topics
Entities
- Nick DunstoneFollow
- Copernicus Climate Change ServiceFollow
- Samantha BurgessFollow
- NOAAFollow
- Paris AgreementFollow
- Walker CirculationFollow
- UK Met OfficeFollow