ScienceIndependently confirmed3 publishers2 min readPublished Updated
The ocean's hottest day on record landed in August, and that is the number that matters
Copernicus logged 21.10 C on Aug. 22, one hundredth of a degree above March 2024. The timing, not the margin, is what should move planning assumptions.
The Scientist · Science desk
What happened
- Copernicus logged a daily global average sea surface temperature of 21.1 C on Aug. 22, the highest in a record that starts in 1979.
- El Nino was declared under way on June 11, and NOAA's Climate Prediction Center gives better than 90% odds of very strong conditions in fall and winter.
- The Met Office says this El Nino will be the largest in living memory and probably the biggest since the 19th century.
Why it matters
- constraint Any envelope calibrated on pre-2024 sea surface temperatures no longer contains the observed case, and the June and July monthly records mean it cannot be dismissed as one satellite day.
- exposure Copernicus names sea level rise, marine heat waves and coral reef damage as the transmission path to food webs and coastal communities; Labe extends the reach to the economy, coastal...
- contradiction Copernicus and the Met Office describe unprecedented strain and an unprecedented event, while Climate Central's Labe calls the record entirely unsurprising.
One hundredth of a degree Celsius is the entire margin here: 21.10 C on Aug. 22 against 21.09 C in March 2024 [1][2][9]. That gap is too small to rebuild a model on. The calendar is the part worth reading. Copernicus says the hottest daily global sea surface temperatures normally arrive in March and April, after the Southern Hemisphere summer, which makes a record set in late August out of character for the series [16].
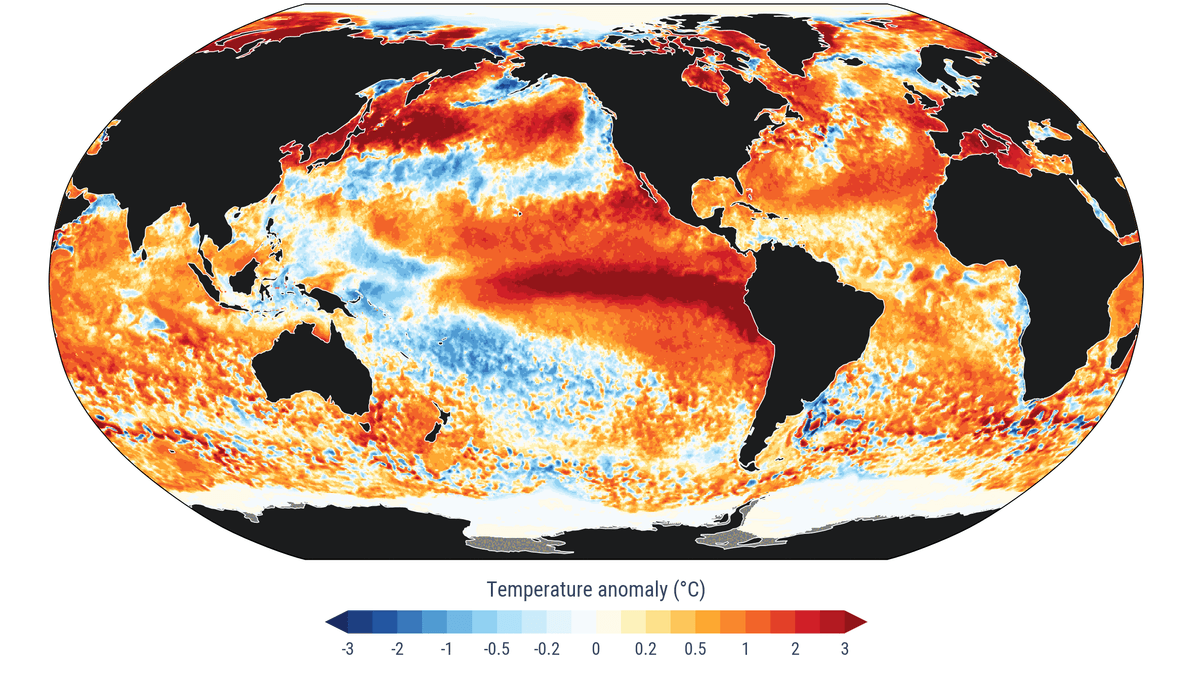
El Niño was only declared under way on June 11 [4], and NOAA's Climate Prediction Center puts better than 90% odds on very strong conditions emerging in fall and winter [5]. The reading therefore precedes both the seasonal maximum and the forecast peak of the warm event [20]. It did not stand alone either: June and July each set records for their own months in the Copernicus data [17]. And the mark it beat was produced by an El Niño that only approached the "super" threshold, weaker than what the Met Office is now forecasting [3][6].
Samantha Burgess of Copernicus stated the mechanism without decoration: El Niño is adding heat to the system, and it is doing so on top of decades of human-driven warming [8]. The El Niño contribution is temporary, the warm phase of a multiyear natural cycle [15]. The baseline under it is not. That asymmetry is why a single hot day in the wrong month reads better as a floor than as a curiosity, and why Zachary Labe of Climate Central expects the value beaten again within months [18].
What the record does not do is guarantee outcomes. A stronger event raises the odds of disruptive weather rather than promising it [14]. The one effect already in evidence is regional: the Met Office reports India's summer monsoon running well below normal [19]. For anyone doing the arithmetic, the distance between 21.09 and 21.10 is noise [9]. The distance between treating 21.1 C as a ceiling and treating it as this season's starting point shows up in reef monitoring budgets and catch forecasts, and it will show up before the March window Copernicus says usually holds the annual high [16].
What to watch
- Whether the next Copernicus bulletins show a higher daily figure in the March-April window, when the seasonal cycle and a peaking El Nino would coincide.
- Whether NOAA's Climate Prediction Center holds its better-than-90% call on very strong conditions through its winter updates.
- Whether marine heat wave and coral bleaching reports follow in the ecosystems Copernicus named as at risk.
Clarity's read
What the record supports and how the coverage leans. The claims behind it follow.
Reality
- Evidence68
- Adoption
- Insufficient
- Hype gap+12
- Incentives
- Insufficient
- Confidence62
Perspective Coverage
3 publishers- Builder
- Builder 18%
- Operator
- Operator 50%
- Investor
- Investor 32%
Claim ledger
Ranked by verification strength, evidence, and original report placement.
- [1]
Copernicus Climate Change Service reported that the daily global average sea surface temperature reached 21.1 C (69.98 F) on Saturday, Aug. 22, hotter than at any time since its records began in 1979.
- [2]
The previous high was 21.09 C (69.96 F), set in March 2024, according to C3S.
- [3]
2024 was the hottest year on record, and its sea surface temperature records were fueled by the previous El Niño, which was on the cusp of the 'super' threshold and so less extreme than what is forecast this time.
- [4]
El Niño was officially under way as of June 11.
- [5]
NOAA's Climate Prediction Center forecasts a more than 90% likelihood of very strong El Niño conditions emerging in the fall and winter.
- [6]
The UK Met Office announced that this year's El Niño will be the largest in living memory and likely the biggest since the 19th century.
- [7]
Adam Scaife, head of long-range forecasting at the Met Office, said in an Aug. 21 statement: 'We should be clear that this is an unprecedented event. I have never seen an El Nino signal this intense in our forecasts.'
- [8]
Samantha Burgess, strategic lead for climate at Copernicus, said the record is 'another clear signal of an ocean under growing stress' and that 'El Nino is adding heat to the system, but it is doing so on top of decades of human-driven warming.'
- [9]
The new record exceeds the previous high by 0.01 C.
- [10]
The Copernicus statement said the ocean is 'under unprecedented strain.'
- [11]
Zachary Labe, a climate scientist at Climate Central, said 'As a climate scientist, this is not surprising to me at all,' calling the record consistent with decades of research on a warming planet.
- [12]
According to Copernicus, a warming ocean means increased sea level rise and higher risk of marine heat waves, and warmer waters harm coral reefs and other key marine ecosystems, which in turn affects food webs and the people who depend on them.
- [13]
Labe said hotter ocean temperatures 'can affect nearly every part of society, including the economy, coastal infrastructure, and global security.'
- [14]
A strong El Nino does not guarantee more severe weather or other impacts, but the risks are higher with a stronger event.
- [15]
El Nino is the warm phase of a multiyear natural climate pattern and is temporarily piling additional warming onto human-driven warming.
- [16]
Copernicus representatives said the hottest daily sea surface temperatures are typically recorded in March and April, after the Southern Hemisphere summer, making a record daily high this late in the year unusual.
- [17]
Both June and July saw record-high average sea surface temperatures for their respective months.
- [18]
Labe said the new record is unlikely to last long: 'This won't be the last time we say this, and unfortunately, it's very possible we could break this record again in the coming months.'
- [19]
The Met Office noted that India's summer monsoon season, one of the regional patterns affected by El Nino, is already experiencing 'well below' normal levels.
- [20]
The Aug. 22 record precedes both the usual March-April seasonal maximum and the fall-winter period in which NOAA forecasts very strong El Niño conditions.
Sources
3 independent publishers whose own reporting we read for this story.
- livescience.comOcean 'under unprecedented strain' as El Niño helps supercharge warming to record levels
1 article · August 24, 2026
- nature.comHighest-ever ocean temperatures recorded as El Niño intensifies
1 article · August 25, 2026
- scientificamerican.comEarth's oceans just hit their hottest temperature ever recorded
1 article · August 24, 2026
Topics and entities
Follow any of these and your For You feed starts watching them — no settings page required.