Meteors lose mass by melting, not vaporising: 75 filmed falls rewrite the entry model
Analysis of 75 videographed meteorite falls puts melting and fragmentation in charge of mass loss. Breakup starts at a fifth of measured meteorite strength, which is where hazard models bend.
The Scientist · Science desk
What happened
- Researchers analysed 75 meteorite falls caught on video and in photographs, split the descent into seven phases, and published in Meteoritics & Planetary Science.
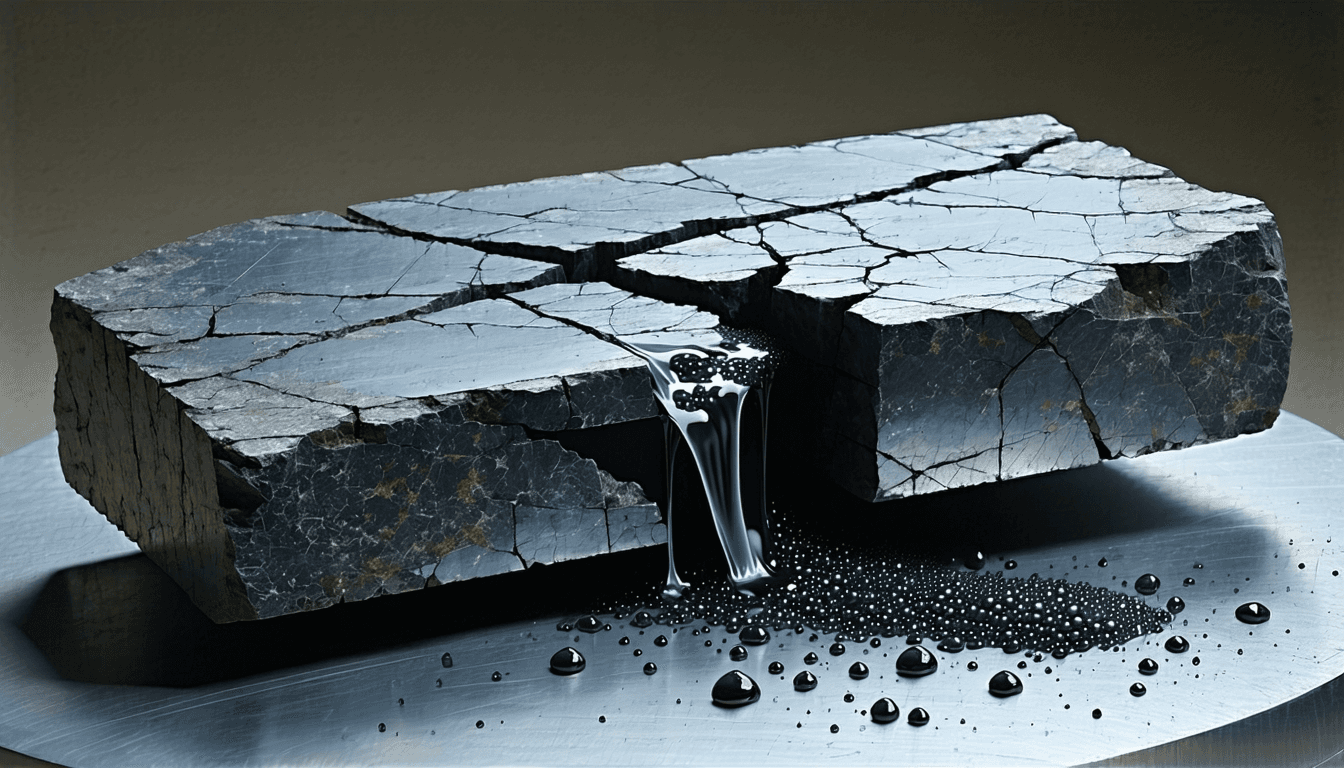
- Once the object becomes a fireball, melting accounts for most mass loss, with airflow peeling molten material into droplets that evaporate behind it.
- At around 60 kilometres the body settles into a melting equilibrium, and melting alone can remove up to 40% of its mass.
Why it matters
- constraint Fireball light now has to be unpicked into two competing loss processes, and Stern says the radiation of a real entry cannot be reproduced in a laboratory, so the calibration cannot be settled on...
- capability Fragment size starts working as provenance: stones above roughly 20 g point back to the trailing face of the parent body rather than anywhere on it.
- precedent Since the ablation equations still fit the deceleration, future entry work will be expected to declare which physical process a fitted coefficient actually stands for.
The case for melting is circumstantial, and worth stating plainly. According to Eric Stern, formerly of NASA Ames and now chief scientist at Hyperspace Technologies, no laboratory can produce the radiation field of a natural entry at those speeds [5], so the argument rests on the shape of the light curve: a rock eroding by aggressive fragmentation would not brighten with the regularity the filmed events show [5]. What that reasoning supports is a change in what is being measured. In the fireball phase the airflow peels molten material off the surface as droplets, and the droplets go on evaporating behind the rock [4], which is not the same thing as the stone turning to vapour on its own account [3][2].
The mathematics does not get thrown out. Co-author Stu Pilorz says the slowdown produced by fragmentation was tied back to the earlier ablation-based descriptions [7], so the equations observers already use still fit the deceleration. Their coefficients now stand for something else. That is a more awkward problem than a wrong number, because a coefficient quietly encoding melt stripping and breakup will keep fitting the event it was tuned on while extrapolating badly to a body with different strength or a different collisional history.
The strength result is the sharper edge. Breakup begins when the pressure in front of the rock is about one fifth of the strength measured in meteorites recovered on the ground [8], a factor of five between the material in hand and the material in flight [15]. The authors attribute the gap to heating and cracking from collisions the body suffered in space [9]. Strength, on that reading, is not a lookup value but a property of the object's history. Fragmentation altitude is what sets where kinetic energy goes into the air, and a model keyed to laboratory strengths will place that breakup deeper than it occurs.
Then the accounting. Melting alone can take up to 40% of the mass before fragmentation gets going [6], so no more than 60% of what entered the fireball phase is still in the main body when the first pieces come off [14]. Only after that does the rock shrink quickly and lose real speed [10]. A recovered stone is the remainder of a remainder, and reading a pre-entry mass off a light curve means splitting two loss processes that both put light in the sky.
The wake geometry is the part of this that can be tested against dirt. Darrel Robertson of NASA Ames says the modelling has the intact rear of the rock pulling a vacuum in its wake, into which fragments flow, dropping small meteorites in a narrow strip [11]. Peter Jenniskens notes that in past falls the stones above roughly 20 g scattered more widely and often came from close to the original surface, which he reads as the backside [12]. The colour of that final flare, red where the earlier ones were green, follows from the body having already lost most of its speed [13], which makes it a cheap indicator of when the rear face gave way.
What to watch
- Whether the one-fifth strength ratio survives as more falls with recovered stones and directly measured strengths are added to the sample.
- Whether airburst and energy-deposition models used for hazard work switch to a history-dependent strength instead of values measured on recovered meteorites.
- Strewn field surveys that test the narrow-strip prediction for stones below about 20 g.
Clarity's read
What the record supports and how the coverage leans. The claims behind it follow.
Reality
- Evidence58
- Adoption
- Insufficient
- Hype gap+18
- Incentives38
- Confidence55
Claim ledger
Ranked by verification strength, evidence, and original report placement.
- [1]
Researchers studied 75 meteorite falls captured on video and in photographs, identified seven distinct phases in the journey from space rock to meteorite, and published the findings in Meteoritics & Planetary Science.
- [2]
The findings show that melting and fragmentation, rather than evaporation and burning up, control how a rock loses mass, slows down and reaches the ground.
- [3]
Lead author Peter Jenniskens, meteor astronomer at the SETI Institute and NASA Ames Research Center, said researchers used to think solid rocks would evaporate from the heat and light of collisions with air, and instead found that first melting and then fragmentation control mass loss.
- [4]
In Phase 3 the meteor becomes a fireball and melting causes most of the rock's mass loss; fast-moving air pulls melted material off the surface, leaving droplets behind that keep evaporating.
- [5]
Eric Stern, formerly at NASA Ames and now chief scientist at Hyperspace Technologies Inc., said the amount of radiation occurring in a natural atmospheric entry at those speeds cannot be generated in the laboratory, and that a rock could aggressively fragment and erode instead, but then the observed systematics in how fireballs brighten would not be expected.
- [6]
At around 60 kilometres altitude the fireball reaches Phase 4, a melting equilibrium in which brightness stays the same or grows at a steady pace, and the rock can ultimately lose up to 40% of its mass from melting alone.
- [7]
Co-author Stu Pilorz of the SETI Institute said the team was able to tie the slowdown from fragmentation to the previous mathematical descriptions based on ablation.
- [8]
Rocks start to break apart when the air pressure in front of the rock is only about one-fifth of the strength measured in meteorites found on Earth.
- [9]
The researchers think heat and cracks from earlier collisions in space can explain why rocks break earlier than expected.
- [10]
Only once fragmentation begins does the remaining rock quickly become smaller and slow down significantly, more rapidly if the rock breaks aggressively.
- [11]
Darrel Robertson of NASA Ames Research Center said modelling shows that as long as the back of the rock remains intact it pulls a vacuum in its wake into which fragments tend to flow, and those small meteorites fall in a narrow strip on the ground.
- [12]
Jenniskens said the final disruption in Phase 6 sends fragments flying at higher relative speeds, and that in past falls meteorites larger than about 20 g tended to be scattered wider and many came from close to the surface of the original space rock, which must have been its backside.
- [13]
Because the rock has already slowed down by Phase 6, the late flares are usually red instead of the bright green seen earlier.
- [14]
If melting can remove up to 40% of the mass before fragmentation begins, then no more than about 60% of the mass entering the fireball phase remains in the main body when breakup starts.
- [15]
Observed breakup begins at a ram pressure about five times lower than the strength measured in recovered meteorites.
Get this ledger inside ChatGPT. Ask about any of our stories and the answer brings its figure, each claim’s verdict and the sources. Free, no account.
Sources
1 independent publisher whose own reporting we read for this story.
- phys.orgNew study reveals how space rocks become meteorites
1 article · August 24, 2026
Topics and entities
Follow any of these and your For You feed starts watching them — no settings page required.
Topics
Entities
- Peter JenniskensFollow
- Eric SternFollow
- Stu PilorzFollow
- Darrel RobertsonFollow
- SETI InstituteFollow
- NASA Ames Research CenterFollow
- Hyperspace Technologies Inc.Follow
- Meteoritics & Planetary ScienceFollow
- Chelyabinsk Airburst (2013)Follow