Science2 publishers3 min readPublished
NASA's COFFIES model flags solar active regions before they surface, averaging 9.24 hours
NASA advertises lead times of up to 12 hours. The published test average is 9.24, and the team says the model is not ready for operational forecasting.
The Scientist · Science desk
Drafted by a language model from the sources cited here and checked against its claim ledger before publication. How we use AISend a correction
What happened
- A team with NASA's COFFIES (Consequence Of Fields and Flows in the Interior and Exterior of the Sun) developed a machine-learning model capable of predicting the emergence of active regions on the Sun up to 12 hours before they appear.
- COFFIES is a NASA DRIVE (Diversify, Realize, Integrate, Venture, Educate) Science Center, and the work brought together researchers from New Jersey Institute of Technology, Princeton University, and NASA's Ames Research Center.
- A research team led by NJIT reports in the Journal of Geophysical Research: Machine Learning and Computation that an AI model called EarlyDetect can identify precursor signals of active region emergence in the Sun's acoustic activity and magnetic field.
- After training on NASA SDO/HMI observations, the researchers tested EarlyDetect on active regions the model had never seen before; the best-performing version identified precursor signals an average of 9.24 hours before active regions became visible, outperforming both a standard Transformer model and a previous benchmark approach.
- The difference between NASA's stated ceiling of 12 hours and the reported test average of 9.24 hours is 2.76 hours.
Compiled by The ScientistSomething wrong?How this is made
Why it matters
A team working under NASA's COFFIES science center has published a machine-learning model that predicts where solar active regions will emerge up to 12 hours before they become visible on the Sun's surface [1]. That matters because today's operational forecasts, run by NOAA's Space Weather Prediction Center and the U.S. Air Force, start from active regions that are already visible and estimate flare probability from their characteristics [11].
The headline number and the tested number are not the same. NASA describes the capability as up to 12 hours [1]; the study, led by NJIT and published in the Journal of Geophysical Research: Machine Learning and Computation, reports that the best-performing version of the model, called EarlyDetect, identified precursor signals an average of 9.24 hours before active regions became visible in tests on regions it had not seen during training [4][5]. That is a gap of about 2.76 hours between the ceiling and the average [6]. Operators planning a satellite safing procedure or a high-frequency comms workaround should budget against the average, not the ceiling.
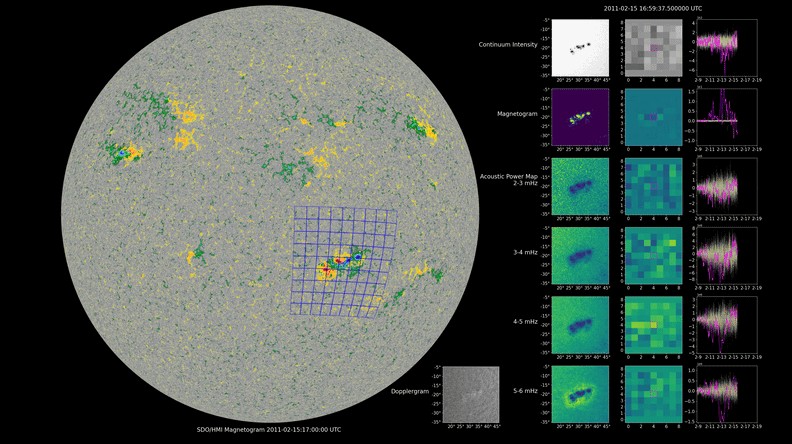
The physical premise is indirect observation. Active regions form beneath the photosphere, where the magnetic structure cannot be seen directly, so the model looks for small changes in the magnetic field and in the pattern of acoustic waves travelling through the Sun, which Alexander Kosovichev of NJIT compared to detecting a slight change in rhythm within a very noisy orchestra [10]. EarlyDetect ingests hourly acoustic power maps plus magnetic field measurements from the Solar Dynamics Observatory, with the acoustic maps derived from sound-wave observations that the Helioseismic and Magnetic Imager records every 45 seconds [7]. That is roughly 80 raw samples compressed into each hourly map [8]. The architecture is a sliding-window transformer: instead of looking at all surface activity at once, it moves a fixed-size window across a long timeline, weighting recent data while retaining longer-run patterns [9]. Training and inference used NASA Ames supercomputing resources [22].
The most useful engineering detail is a negative result. The team had applied a filtering step expected to isolate short-timescale patterns, and found it made forecasts worse in almost every case, because it averaged away the faint fluctuations carrying the earliest warning, according to Kosovichev and corresponding author Jonas Tirona, an NJIT undergraduate [14][15][16]. Anyone building a precursor detector on noisy geophysical data should read that as a warning about preprocessing that assumes the signal is the trend.
The operational value depends on how the timing lines up with the physics. Active regions begin emerging over several hours, and full development can take one to several days [17]. Those regions are the main drivers of flares and coronal mass ejections, which send high-energy radiation and charged particles that can threaten astronauts, disable satellites, and disrupt radio communications [24][18]. Tirona said the early warning could let satellite communications or power grid companies prepare and potentially mitigate damage [19]. The shift is from counting visible sunspots to predicting approximate locations of emerging ones [12].
Two caveats are stated by the team itself. The model is not ready for real-time operational forecasting, and the next step is validating it across many more known solar events for tuning [13]. Mengjia Xu, the project's principal investigator at NJIT, said machine learning has not yet been widely applied to solar activity forecasting [20].
Watch whether the 9.24-hour average holds up on a larger validation set, whether NOAA's forecast center shows any interest in ingesting precursor products alongside its visible-region analysis [11][13], and what other groups do with the dataset the team has released [21].