ScienceNot yet confirmed elsewhere1 publisher2 min readPublished
Lipid map of the mouse brain turns up 539 chemically distinct zones
EPFL researchers scanned thin mouse brain slices for lipids and assembled a 3D atlas of 539 zones they named lipizones. White matter, once thought fairly uniform, split into many of them.
The Scientist · Science desk
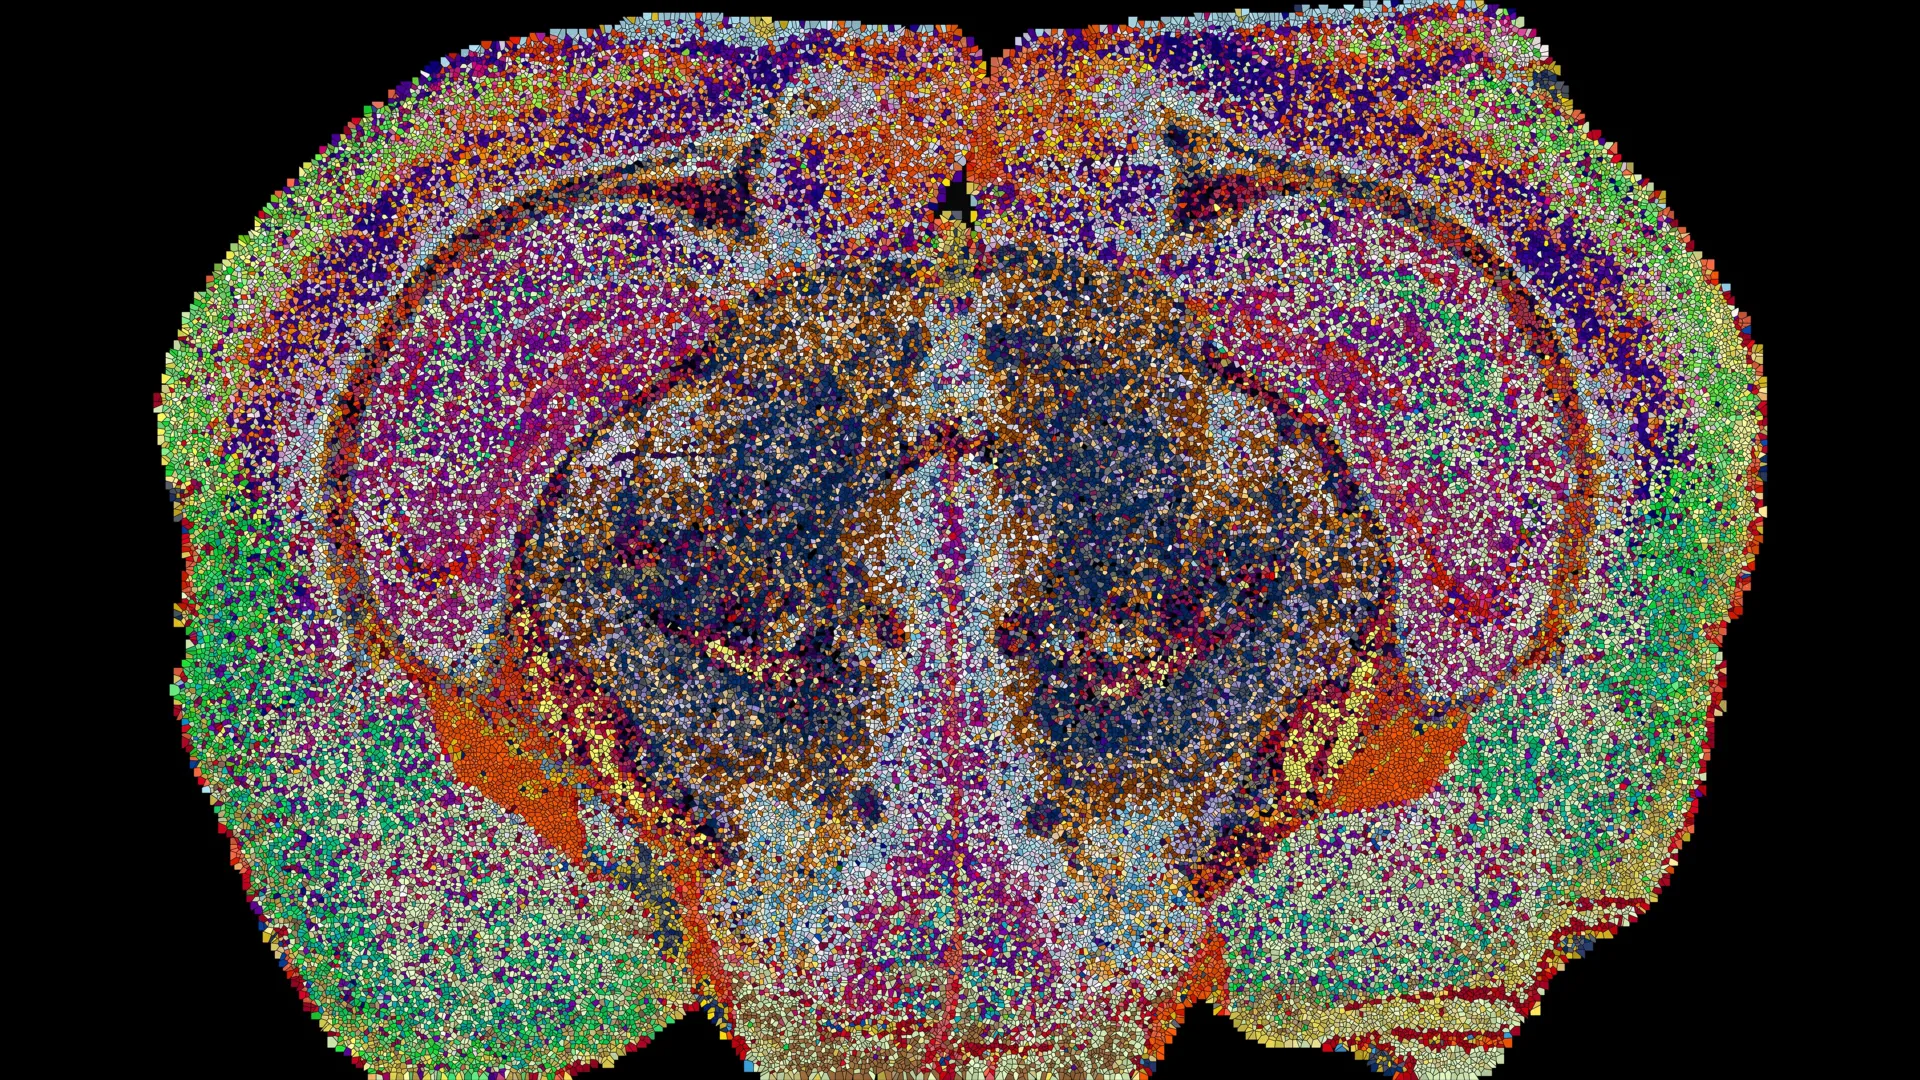
Key figures: approximately 7 million measurements combined into a 3D reconstruction; 172 different lipids examined; 109 brain slices, collected from 11 mice.
| Figure | Value | Note | Claim |
|---|---|---|---|
| Measurements combined into 3D reconstruction, about | 7,000,000 measurements | 6 | |
| Different lipids examined | 172 lipids | 4 | |
| Brain slices examined | 109 slices | collected from 11 mice | 5 |
What happened
- The work, led by Giovanni D'Angelo, Luca Fusar Bassini and Gioele La Manno at EPFL, was published in Nature.
- The measurements came from mass spectrometry imaging, in which a laser scans each tissue slice one location at a time and records which lipids are present.
- The team tracked 172 lipids and used machine-learning tools built for the project to combine about 7 million measurements into one 3D reconstruction.
- The lipid patterns were distinctive enough that researchers could tell where a tissue sample came from by its lipid composition alone.
- The atlas also showed previously unrecognized chemical boundaries in the choroid plexus, which produces cerebrospinal fluid, and in the tissue lining the brain's internal cavities.
Why it matters
- decision Anyone building a brain reference who treats white matter as a single compartment now has a documented reason to subdivide it.
- constraint The link D'Angelo cites between brain lipids and conditions such as depression and Alzheimer's is the motivation for the atlas, which itself charts mouse tissue. Tying zones to disease is separate work.
- contradiction The release's summary says traditional brain maps missed these patterns, but its specifics name gene-activity maps only. For other atlas types it says previous approaches overlooked some boundaries.
Eleven animals is a small base for 539 zones. In EPFL's account of the work, the atlas rests on 109 slices from 11 mice [5], about ten slices per animal [15]. The release does not give the mice's strain, age or sex, or say how the team arrived at a count of 539.
Lipids were missing from brain atlases partly for a technical reason: conventional imaging cannot easily distinguish individual lipid molecules [17]. The white matter result is where that gap shows. Luca Fusar Bassini said, "This shows that the cells which make myelin are far more varied in their chemistry than their genes alone would suggest." [13]
The release makes a second claim about genes. Some lipid zones link groups of nerve cell bodies to distant regions their fibers reach, and such connections have often been hard to detect in maps based on gene activity [12]. Giovanni D'Angelo, who led the team, put it this way: "In effect, lipids work like postal codes, giving distant but related parts of the brain the same chemical address." [14]
The sample-origin result is the check we would look at first [9]. It asks whether the zones are reproducible enough to work as coordinates, which is a stronger claim than saying the clustering found something. How much it proves depends on whether the tested samples were held out when the map was built.
What to watch
- Whether other labs reproduce the 539 lipizones, and whether the zones survive a different clustering choice or a different set of mice.
- Whether a lipid atlas of human brain tissue shows comparable zones, including inside white matter.
- Whether lipizone boundaries shift in mouse models of depression or Alzheimer's disease, the conditions D'Angelo links to brain lipid changes.
Clarity's read
What the record supports and how the coverage leans. The claims behind it follow.
Reality
- Evidence58
- Adoption
- Insufficient
- Hype gap+20
- Incentives45
- Confidence52
Claim ledger
Ranked by verification strength, evidence, and original report placement.
- [1]
A team at EPFL led by Giovanni D'Angelo, Luca Fusar Bassini and Gioele La Manno created a detailed map, the Lipid Brain Atlas, showing how lipids are distributed throughout the mouse brain.
- [2]
The findings were published in Nature.
- [3]
The researchers used mass spectrometry imaging, in which a laser scans each brain slice one location at a time, producing information about which lipids are present and where.
- [4]
The team examined 172 different lipids.
- [5]
The lipids were examined in 109 brain slices collected from 11 mice.
- [6]
The work generated approximately 7 million measurements, which scientists combined into a 3D reconstruction using machine learning tools developed specifically for the project.
- [7]
The atlas revealed 539 chemically distinct territories, named lipizones, each with a characteristic combination of lipids.
- [8]
White matter, previously considered relatively uniform, contains numerous distinct lipid zones rather than a largely consistent chemical composition.
- [9]
The lipid patterns are distinctive enough that researchers could identify where a brain tissue sample originated simply by examining its lipid composition.
- [10]
The researchers detected previously unrecognized chemical boundaries in the choroid plexus, which produces cerebrospinal fluid, and in the tissues lining the brain's internal cavities.
- [11]
Some lipid patterns match familiar anatomical structures, while others expose chemical boundaries that previous approaches had overlooked.
- [12]
Some lipid zones reveal unexpected relationships between groups of nerve cell bodies and distant regions connected by their fibers; such connections have often been difficult to detect using maps based on gene activity.
- [13]
"This shows that the cells which make myelin are far more varied in their chemistry than their genes alone would suggest," said Luca Fusar Bassini.
- [14]
"In effect, lipids work like postal codes, giving distant but related parts of the brain the same chemical address," said Giovanni D'Angelo.
- [15]
The 109 slices from 11 mice average about 9.9 slices per mouse.
- [16]
Giovanni D'Angelo said changes in brain lipids are increasingly linked to conditions from depression to Alzheimer's disease.
- [17]
Conventional imaging techniques cannot easily distinguish individual lipid molecules, which left a gap in understanding the brain's chemical organization.
Sources
1 independent publisher whose own reporting we read for this story.
- sciencedaily.comScientists uncover a hidden map of the brain with 539 distinct regions
1 article · October 12, 2026
Topics and entities
Follow any of these and your For You feed starts watching them — no settings page required.
Topics
- Mass Spectrometry ImagingFollow
- LipidomicsFollow
- NeuroscienceFollow