InvestNot yet confirmed elsewhere1 publisher3 min readPublished
Calmer bitcoin logs more three-sigma days in 2026 than in all of 2018
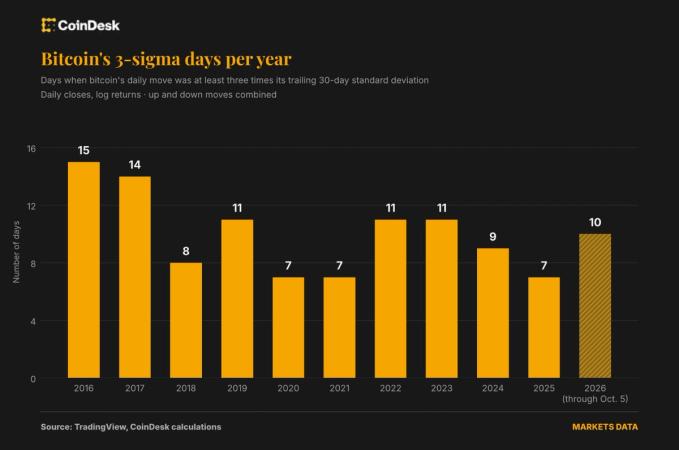
Bitcoin has logged 10 three-sigma days in 2026, more than in all of 2018, while its annualized volatility fell to about 46% from 84%, a CoinDesk analysis found. Risk models that lean on recent prices read that calm as lower risk and can approve bigger bitcoin positions than the tail record supports.
The Investor · Invest desk
What happened
- Bitcoin's three-sigma moves have averaged roughly 7% this year, down from about 10% in 2018, so the outsized days are smaller even as they come more often.
- Since 2024 bitcoin has run at about the same 47% volatility as Nvidia yet logged 26 three-sigma days to Nvidia's eight, while the S&P 500 had 16 and gold had 12.
- CryptoBriefing reported that volatility tied to sudden price jumps has risen 71% compared with the first year of spot bitcoin ETF trading.
- Implied volatility drawn from options prices has followed realized volatility lower heading into 2026, according to CryptoBriefing.
Why it matters
- exposure Allocators who set bitcoin exposure from 30-, 90- or 180-day volatility get a bigger position allowance as those readings fall, though the tail days those readings are meant to bound keep arriving.
- contradiction CryptoBriefing takes the shallower drawdown as grounds to size bitcoin more easily into portfolios, while CoinDesk warns volatility-based models may encourage allocations that are too large.
- cost If implied volatility keeps falling while jump volatility rises, option sellers collecting premium in quiet markets would take the first loss from a sharp move, CryptoBriefing argues.
CoinDesk's tally is relative by design. Each day's price move was set against bitcoin's realized volatility over the previous 30 days, and any day that moved at least three times that amount, up or down, was counted [5]. A move that would have been ordinary in a turbulent 2018 month can qualify after a quiet one [5]. That construction lines up with the value-at-risk models CoinDesk describes, some of which rely heavily on recent price fluctuations, so a calm stretch makes an asset look less risky [10]. In our view the 10 days are close to a count of how often a risk band drawn from the prior month would have been broken at three sigma this year [1][5].
A bell curve keeps 99.7% of moves within three sigma [7]. The other 0.3% comes to about 1.1 days in a 365-day year [14]. On that basis 2018's eight such days were roughly seven times what a normal distribution predicts, and 2026's 10 so far are about nine times [17]. A model that scales its bad-day estimate to annualized volatility would have cut that estimate by about 45% between the two years [13], while the average three-sigma move fell about 30% [15].
The comparison across assets points the same way. Bitcoin's three-sigma count since 2024 is about 3.25 times Nvidia's at roughly the same 47% volatility [16]. A sizing rule that treats the two as equivalent on volatility alone gives them the same allowance for very different tail records [8].
"Bitcoin still goes through long quiet stretches followed by sharp repricings, and that hasn't changed. The market has matured, with more institutions, ETFs and much deeper liquidity, so the average day is calmer. But the shocks haven't gone away: macro, leverage, positioning," said Nicolas Quatravaux, head of EMEA at Paradigm, a liquidity network for crypto derivatives traders [9].
"Standard VaR measures do not properly assess the full tail risk, and this is one of the main reasons industry has been moving towards Expected Shortfall and similar measures, that do take tail risk into account," said Luuk Strijers, chief executive of the crypto options exchange Deribit [11]. VaR estimates a loss threshold without saying how severe losses get beyond it. Expected shortfall looks at how bad the worst days are [12].
The problem is smaller if most institutional books already run expected shortfall, the direction Strijers describes; the oversizing risk would then sit with simpler volatility-targeting setups [11][10]. It is also smaller if drawdowns keep coming in shallower. CryptoBriefing put this cycle's fall at roughly 53-54%, from about $126,200 in October 2025 to near $58,000 by mid-2026 [4], against the 73% bitcoin lost in 2018 [3].
We think the exposure is concentrated in books that size on a short window, because a 30-day window is what CoinDesk's count is scored against [5]. Holders who size on drawdown have a better cycle to point to [4]. CoinDesk's analysis does not include data on allocators' position sizes or flows, so its warning about oversized allocations rests on how the models are built [10]. Disclosures showing bitcoin position sizes held flat as 30-day volatility fell would undercut that warning.
What to watch
- Whether bitcoin's 2026 three-sigma count keeps climbing past 10 through year-end as 30-day volatility settles lower.
- Whether crypto venues and allocators add expected shortfall alongside value-at-risk in the position limits they publish, the move Strijers says the industry is making.
Clarity's read
What the record supports and how the coverage leans. The claims behind it follow.
Reality
- Evidence60
- Adoption
- Insufficient
- Hype gap+12
- Incentives45
- Confidence58
Claim ledger
Ranked by verification strength, evidence, and original report placement.
- [1]
Bitcoin has recorded 10 days in 2026 when its price moved at least three standard deviations from its recent trading pattern, according to a CoinDesk analysis, more than the eight such days recorded during all of 2018.
ReportedSupportedSource: CoinDesk analysis2 sources— create a free account to open themView cited source - [2]
Bitcoin's annualized volatility is about 46% this year, compared with 84% in 2018.
ReportedSupportedSource: CoinDesk analysis2 sources— create a free account to open themView cited source - [3]
Bitcoin lost 73% of its value in 2018.
- [4]
Bitcoin hit an all-time high around $126,200 in October 2025 and slid to lows near $58,000 by mid-2026, a drawdown of approximately 53-54%; previous cycles saw it shed 70-82% after a peak.
ReportedSupportedSource: CryptoBriefing2 sources— create a free account to open themView cited source - [5]
CoinDesk compared each day's price move with bitcoin's 30-day realized volatility; any day that moved at least three times that amount, up or down, counted as a 3-sigma day.
- [6]
Bitcoin's 3-sigma moves have averaged roughly 7% this year, down from about 10% in 2018.
- [7]
In a normal bell-shaped distribution, about 95% of moves fall within 2-sigma and 99.7% within three.
- [8]
Since 2024 bitcoin has been about as volatile as Nvidia, at roughly 47%, yet has logged 26 three-sigma days compared with Nvidia's eight; the S&P 500 had 16 and gold had 12.
- [9]
"Bitcoin still goes through long quiet stretches followed by sharp repricings, and that hasn't changed. The market has matured, with more institutions, ETFs and much deeper liquidity, so the average day is calmer. But the shocks haven't gone away: macro, leverage, positioning,"
ReportedSupportedSource: Nicolas Quatravaux, head of EMEA at Paradigm, quoted by CoinDeskView cited source - [10]
Some VaR models rely heavily on recent price fluctuations, so a prolonged calmer stretch can make an asset appear less risky; bitcoin's declining 30-, 90- and 180-day volatility could encourage investors to increase exposure, and standard VaR may understate bitcoin's tail risk and encourage overly large portfolio allocations.
- [11]
"Standard VaR measures do not properly assess the full tail risk, and this is one of the main reasons industry has been moving towards Expected Shortfall and similar measures, that do take tail risk into account,"
- [12]
VaR estimates a loss threshold but does not tell investors how severe losses could become beyond it; expected shortfall looks at how bad losses get on the worst days.
- [13]
Bitcoin's annualized volatility fell about 45% between 2018 and 2026.
- [14]
A normal distribution leaves about 0.3% of days beyond three sigma, or about 1.1 days in a 365-day year.
- [15]
The average three-sigma move fell about 30% between 2018 and 2026.
- [16]
Bitcoin's three-sigma count since 2024 is about 3.25 times Nvidia's.
- [17]
2018's eight three-sigma days were roughly seven times a normal distribution's annual expectation, and 2026's 10 so far are about nine times.
- [18]
For long-term investors, shallower drawdowns of around 53% compared to historical drops of 70-82% make bitcoin easier to size into a diversified portfolio.
ReportedContestedSource: CryptoBriefing2 sources— create a free account to open themView cited source - [19]
If implied volatility keeps falling while sudden jumps keep rising, the market could be underpricing the chance of a sharp move, and traders who sell options to collect premium in quiet conditions would be most exposed.
ReportedInsufficientSource: CryptoBriefing2 sources— create a free account to open themView cited source - [20]
Volatility tied to sudden price jumps has climbed by 71% compared to the first year of spot Bitcoin ETF trading.
- [21]
Implied volatility, derived from options prices, has followed realized volatility on a downward path heading into 2026.
Sources
1 independent publisher whose own reporting we read for this story.
- coindesk.comBitcoin's volatility has plunged, but extreme price swings are more frequent than in 2018
1 article · October 9, 2026
- cryptobriefing.comBitcoin’s volatility is falling, but its extreme price swings now outpace 2018
1 article · October 9, 2026
Topics and entities
Follow any of these and your For You feed starts watching them — no settings page required.