ScienceNot yet confirmed elsewhere1 publisher2 min readPublished
Satellite model puts many of 590 Alpine peatlands below their official map size
Satellite data put many of 590 mapped peatlands in Austria, Germany and Switzerland below their official map size, researchers report. They link the gap to drainage ditches, paths and encroaching scrub seen in aerial photographs, and say restoration planning needs current data.
The Scientist · Science desk
What happened
- Alpine peatlands are mostly small, scattered and hard to reach, so current information on their extent and condition is often missing.
- The model combines visible-light and radar satellite data from 2019 to 2023 with on-the-ground studies, and its output was compared with official peatland maps.
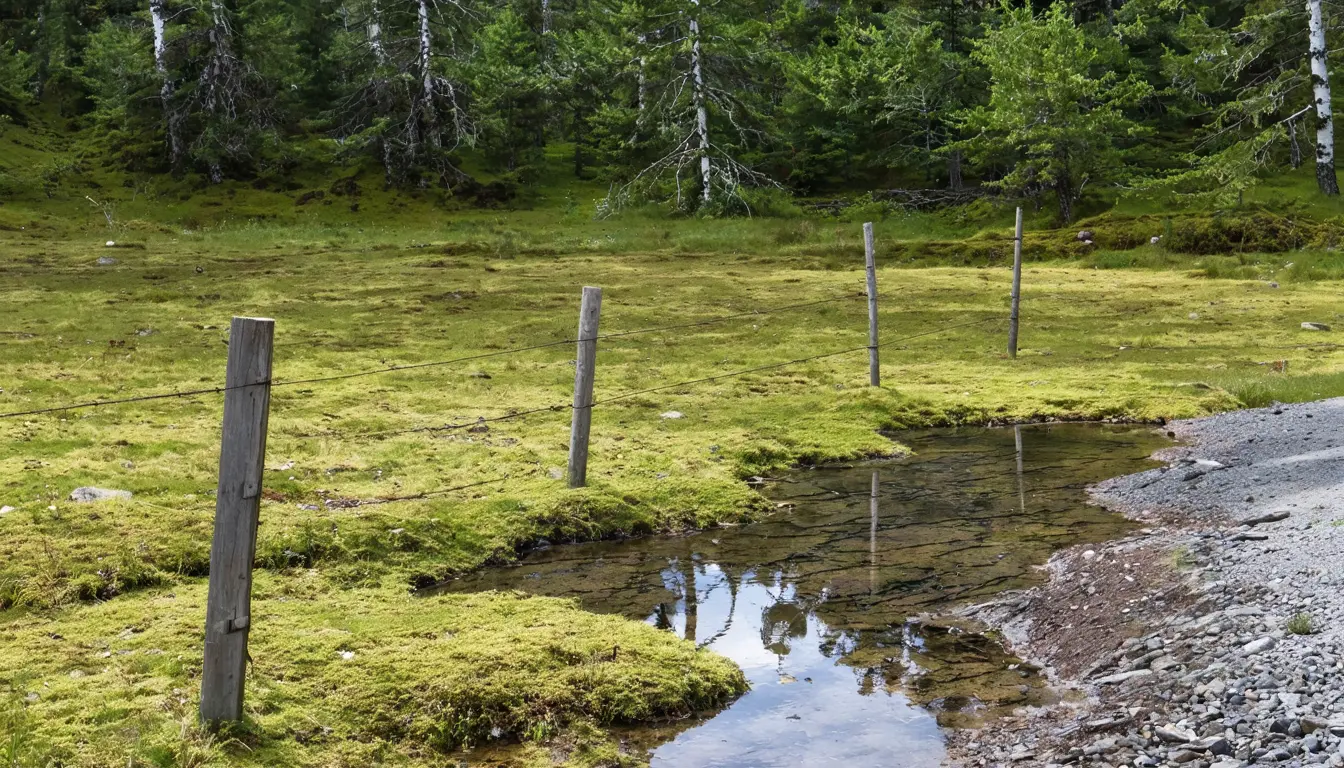
- The shortfall against the official maps was most pronounced where aerial photographs show visible signs of disturbance.
- Signs of disturbance were visible at almost 90% of the sites, including encroaching trees and shrubs, new infrastructure and drainage ditches dug for uses such as hay production.
Why it matters
- decision Agencies planning restoration from the official outlines have a reason to check boundaries first, since the authors say current data are needed to target interventions.
- constraint The sample is peatlands already on maps, so the result cannot say how many are missing from them or how much area that would add.
- capability The freely available approach lets regional mappers monitor peatlands by satellite on a regular schedule and aim field surveys at flagged sites.
The team's first reaction was to doubt the model. "At first, we thought the model was wrong. But then we discovered that these 'too small' bogs were mostly located in areas that had clearly been disturbed by activity, such as new drainage ditches or paths," said lead author Dr. Marian Schönauer of Mendel University in the Czech Republic [12]. The aerial photographs matter to the design for that reason. They come from a source separate from the satellites, and they supplied possible causes for the smaller outlines [9].
The size of the effect is not reported. The researchers say the model often indicated significantly smaller areas than the official maps show [6]. All 590 sites were already on maps [2], so peatlands that no map includes fall outside the sample. The summary does not include a count of affected sites, an area figure, the dates of the official maps, or whether the almost-90% disturbance share [8] covers all 590 sites or only the flagged ones.
Those omissions decide how far to trust the causal story. If the share covers all 590 sites, disturbance was present at fewer than 531 of them [11], and a feature present at nearly every site says little about which outlines shrank. The control would be the disturbance rate at sites where model and official map agree.
The map dates matter for a different reason. If the maps predate the drainage, the gap is change on the ground. If they do not, it is mapping error. The authors list new infrastructure and drainage for agricultural use among the signs [8], which leans toward the first reading, though the summary does not settle it.
The study reports no carbon measurement. Dr. Simon Drollinger of Göttingen University said: "Our analysis shows that the condition of many bogs in the Alpine region may be more severely affected than previously thought, and that up-to-date data are crucial for planning targeted conservation and restoration interventions" [13]. The paper's title speaks of widespread degradation in a multi-sensor mapping workflow [4]. A smaller outline would change the area that any inventory or restoration budget starts from, but the stated findings concern extent and condition.
We think the sound use is triage. The authors say the approach can support regular satellite monitoring and the planning of targeted field surveys [10], and a site where model and map disagree tells a surveyor where to go first. We would not redraw a protected boundary from the satellite outline alone. The evidence so far is a pattern across 590 sites, and a boundary needs to be checked on the ground.
What to watch
- A breakdown of how many of the 590 sites came out smaller and by how much, with the disturbance rate at sites where model and map agree.
- Field delineation of flagged sites to confirm the satellite outlines.
- Whether the Austrian, German and Swiss mapping bodies adopt the workflow to update official peatland maps.
Clarity's read
What the record supports and how the coverage leans. The claims behind it follow.
Reality
- Evidence55
- Adoption
- Insufficient
- Hype gap+12
- Incentives
- Insufficient
- Confidence55
Claim ledger
Ranked by verification strength, evidence, and original report placement.
- [1]
An international research team including researchers from the University of Göttingen developed a cross-border approach to identifying peatlands, with findings published in the journal Communications Earth & Environment.
- [2]
The team analyzed 590 peatlands already on maps in Austria, Germany and Switzerland.
- [3]
The model combines data from satellites sensing visible light and from radar satellites, collected from 2019 to 2023, alongside data from on-the-ground studies, and the results were compared with official peatland maps.
- [4]
The paper is titled 'Peatlands mapped across the European Alps with a harmonised multi-sensor workflow show widespread degradation' (Communications Earth & Environment, 2026).
- [5]
Peatlands in the Alps are mostly small, scattered and difficult to access, so up-to-date information on their extent and condition is often lacking.
- [6]
The model often indicated that peatland areas were significantly smaller than those shown on the official maps.
- [7]
The model identifies many peatlands as smaller than previously mapped, particularly in areas where aerial photographs reveal visible signs of disturbance.
- [8]
Signs of disturbance were visible at almost 90% of the sites: encroaching trees and shrubs, new infrastructure, or drainage for agricultural use such as hay production, with drainage ditches visible in the aerial photographs.
- [9]
The latest aerial photographs provided clues as to possible causes of the smaller outlines.
- [10]
The researchers call for a more comprehensive survey of Alpine peatlands and better coordination of their protection and restoration; their freely available approach can enable regular satellite monitoring, the planning of targeted field surveys and the keeping of maps up to date.
- [11]
If the almost-90% disturbance share applied to all 590 sites, disturbance would be present at fewer than 531 sites.
- [12]
"At first, we thought the model was wrong. But then we discovered that these 'too small' bogs were mostly located in areas that had clearly been disturbed by activity, such as new drainage ditches or paths,"
ReportedInsufficientSource: Dr. Marian Schönauer, lead author, Mendel University in the Czech RepublicView cited source - [13]
"Our analysis shows that the condition of many bogs in the Alpine region may be more severely affected than previously thought, and that up-to-date data are crucial for planning targeted conservation and restoration interventions."
ReportedInsufficientSource: Dr. Simon Drollinger, Bioclimatology, Göttingen UniversityView cited source
Sources
1 independent publisher whose own reporting we read for this story.
- phys.orgSatellite model finds Alpine peatlands may be smaller than official maps show
1 article · October 13, 2026
Topics and entities
Follow any of these and your For You feed starts watching them — no settings page required.
Topics
- Satellite Remote Sensing MissionsFollow
- PeatlandsFollow
- Ecosystem restorationFollow
- Alpine environmentFollow