Seven of 16 tracked climate indicators sit at record extremes in the 2026 BioScience report
Oregon State scientists leading an international coalition report in BioScience that seven of the 16 climate indicators they track are at record extremes. Its authors frame the destabilization as a diagnosis, with renewables and battery storage advancing alongside it.
The Scientist · Science desk
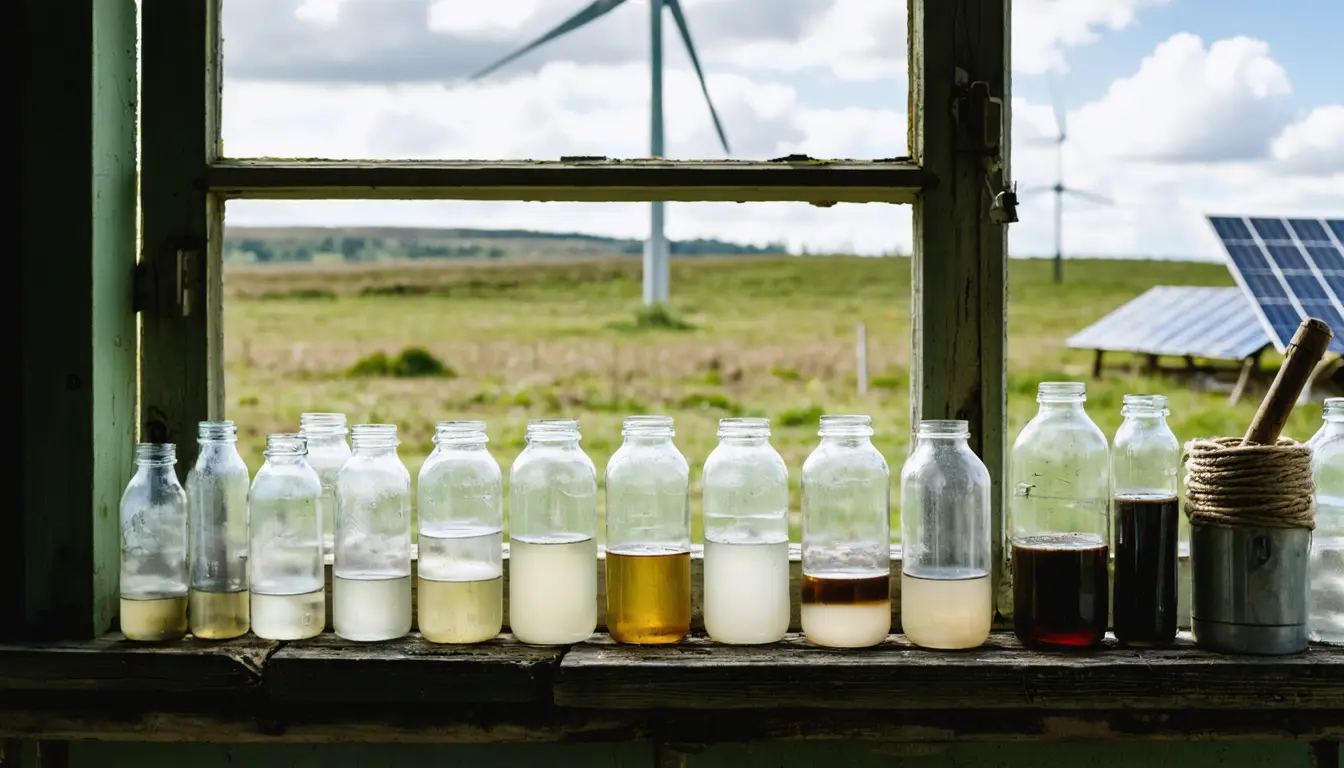
Key figures: warming of about 0.36 degrees Celsius per decade since 2010, against about 0.19 degrees per decade from 1970 to 2010. The newer rate rests on a window about 16 years long; the earlier window is 40 years long.
| Figure | Value | Note | Claim |
|---|---|---|---|
| Warming rate since 2010, about | 0.36 °C per decade | 4 | |
| Rate 1970-2010, about | 0.19 °C per decade | 5 | |
| Post-2010 window, about | 16 years | 14 |
What happened
- The report puts the rate of warming at about 0.36 degrees Celsius per decade since 2010, against about 0.19 per decade from 1970 to 2010.
- Fossil fuel consumption rose 0.9% in 2025 with oil, coal and gas each at a record, and energy-related carbon dioxide emissions passed 41 gigatonnes for the first time.
- Co-lead author Christopher Wolf said low-carbon sources now provide about 43% of global electricity.
Why it matters
- contradiction Both outlets present clean-power growth as encouraging, yet fossil consumption still rose in 2025. Ripple's own test, deployment fast enough to reduce fossil use, was not met that year.
- constraint The doubling in warming rate compares a 40-year window with one of about 16 years, so it is a rougher estimate than the record count, and no uncertainty range was reported in either summary.
- decision Planners face a second budget line: the authors say emissions cuts are no longer sufficient alone and list quick adaptation measures such as urban cooling, wildfire preparedness and water conservation.
Four of the seven records are sea level, ocean heat content, glacier thickness and Greenland ice mass. The other three are concentrations of the most common greenhouse gases [3][12]. The 16 are the indicators the coalition itself tracks, and multiple others that are not at a record are also trending the wrong way [2]. We think the count describes levels. The thing it doesn't tell you is how fast any of them is changing.
The report makes a separate claim about speed. Phys.org's summary says the rate of warming "appears to be accelerating," from about 0.19 degrees Celsius per decade across 1970 to 2010 to about 0.36 since [4]. That is a factor of about 1.9 [13]. Eos dates the second period as 2010 to the present [5], a window of about 16 years against 40 for the first [14]. In our view, a slope fitted to 16 years is a rougher estimate than one fitted to 40. A very strong El Nino expected to develop this fall could also add substantially to warming in the coming months, according to the report [16]. Neither summary reports an uncertainty range for either rate.
Nico Wunderling, a climate scientist at the Potsdam Institute for Climate Impact Research who was not involved in the report, wrote that its "worrying negative trends" "need to be watched closely" [18]. He also called the scale and speed of the solutions it describes "particularly encouraging" [19]. Eos adds that there is some evidence the rate of climate change, not the global temperature itself, could trigger a slowing of the Atlantic Meridional Overturning Circulation [20]. If that holds, the warming-rate comparison matters more for that tipping point than the record count does.
The energy figures point in two directions. Renewable energy passed coal in global electricity generation in 2025, and Ripple called that an "important turning point" [11]. Low-carbon sources, counted separately, supply about 43% of electricity [10]. Fossil fuel consumption still rose [9]. Co-lead author Christopher Wolf said: "That is a reason for hope, but fossil fuel use and emissions are still at record levels, so the transition needs to accelerate dramatically." [6] Ripple wrote: "The challenge now is getting them deployed fast enough to actually reduce fossil fuel consumption." [7]
Ripple, the other co-lead author, framed the report this way: "Rapid destabilization is now a diagnosis rather than a warning for the future," he said [8]. He said the annual report's purpose is to monitor the Earth's "vital signs" and to encourage leaders to "move away from the business-as-usual approach that's persisted despite decades of evidence showing that human activities are driving dangerous changes in the climate." [17]
What to watch
- Whether the very strong El Nino expected this fall lifts the 2026 warming rate and the number of indicators at records in the next edition.
- Whether global fossil fuel consumption falls in a year when low-carbon electricity keeps growing; the 2025 figure rose 0.9%.
Clarity's read
What the record supports and how the coverage leans. The claims behind it follow.
Reality
- Evidence72
- Adoption
- Insufficient
- Hype gap+15
- Incentives45
- Confidence68
Perspective Coverage
4 publishers- Builder
- Builder 14%
- Operator
- Operator 55%
- Investor
- Investor 31%
Claim ledger
Ranked by verification strength, evidence, and original report placement.
- [1]
The 2026 state of the climate report, titled 'The 2026 state of the climate report: challenges and opportunities', is the seventh annual report by an international coalition led by Oregon State University scientists and is published in BioScience.
- [2]
Of the 16 climate indicators the coalition tracks, seven are at record extremes and multiple others are also trending in the wrong direction.
- [3]
The indicators at record extremes are global sea level, global ocean heat content, worldwide glacier thickness, the mass of the Greenland ice sheet, and the atmospheric concentration of each of the three most common greenhouse gases.
- [4]
The rate of global warming appears to be accelerating, nearly doubling from about 0.19 degrees Celsius per decade from 1970 to 2010 to about 0.36 degrees per decade since then.
- [5]
Eos reports the report says warming has doubled from about 0.19 C per decade from 1970-2010 to about 0.36 C per decade from 2010 to present day.
- [6]
"That is a reason for hope, but fossil fuel use and emissions are still at record levels, so the transition needs to accelerate dramatically," said co-lead author Christopher Wolf.
- [7]
"The challenge now is getting them deployed fast enough to actually reduce fossil fuel consumption," Ripple wrote.
- [8]
"Rapid destabilization is now a diagnosis rather than a warning for the future," said William Ripple, co-lead author of the report and distinguished professor emeritus in the OSU College of Forestry.
- [9]
Fossil fuel consumption increased by 0.9% in 2025, with oil (+1.0%), coal (+0.4%) and gas (+1.3%) all reaching record highs, and annual energy-related carbon dioxide emissions surpassed 41 gigatonnes for the first time.
- [10]
Low-carbon sources now provide about 43% of global electricity, according to co-lead author Christopher Wolf, a former Oregon State postdoctoral researcher.
- [11]
In 2025, renewable energy surpassed coal in global electricity generation, an "important turning point," Ripple wrote.
- [12]
Four named non-gas indicators plus three greenhouse gas concentrations make seven, matching the seven of 16 indicators at record extremes.
- [13]
The later warming rate is about 1.9 times the earlier one.
- [14]
The 1970-2010 window is 40 years long; the 2010-to-2026 window is about 16 years long.
- [15]
The authors stress that cutting emissions remains essential but is no longer sufficient by itself, and call for rapidly deployable adaptation measures such as urban cooling, wetland and mangrove restoration, wildfire preparedness, water conservation, distributed solar energy and more resilient food systems.
- [16]
A very strong El Nino expected to develop this fall could add substantially to global warming in the coming months, putting 2026 on track to be one of the hottest years on record.
- [17]
The purpose of the annual report, Ripple said, is to monitor the Earth's "vital signs" and to encourage global leaders and policymakers to "move away from the business-as-usual approach that's persisted despite decades of evidence showing that human activities are driving dangerous changes in the climate."
- [18]
Nico Wunderling, a climate scientist at the Potsdam Institute for Climate Impact Research who was not involved in the BioScience report, wrote that the "worrying negative trends" in the report "need to be watched closely."
- [19]
Wunderling agreed that the scale and speed of solutions reported in the BioScience assessment were "particularly encouraging."
- [20]
There is some evidence that it is the rate of climate change rather than the actual global temperature that could trigger the slowing of the Atlantic Meridional Overturning Circulation (AMOC).
Get this ledger inside ChatGPT. Ask about any of our stories and the answer brings its figure, each claim’s verdict and the sources. Free, no account.
Sources
4 independent publishers whose own reporting we read for this story.
- eos.org2026 State of the Climate Report Shows a Planet Reaching Its Limits
1 article · October 14, 2026
- phys.orgEarth's climate system increasingly unstable, but signs of positive change emerge
1 article · October 14, 2026
- scientificamerican.comClimate scientists issue a sobering diagnosis about Earth's 'vital signs'
1 article · October 14, 2026
- wired.comEarth’s Condition Is ‘Serious and Getting Worse’ as Climate Change Intensifies
1 article · October 14, 2026
Topics and entities
Follow any of these and your For You feed starts watching them — no settings page required.
Topics
- Energy TransitionFollow
- Climate Tipping PointsFollow
- Climate changeFollow
- Fossil fuel emissionsFollow
Entities
- Christopher WolfFollow
- Nico WunderlingFollow
- Oregon State UniversityFollow
- Potsdam Institute for Climate Impact ResearchFollow
- BioScienceFollow
- William RippleFollow