Science1 publisherNot yet confirmed elsewhere3 min readPublished
North Carolina's coastal forest gave way to marsh and ghost forest three times faster per year after 2010
NC State satellite mapping shows North Carolina lost 21% of its coastal forest, about 64,220 hectares, between 1985 and 2021, mostly to rising seas. Measured per year, conversion to marsh, ghost forest and shrub after 2010 ran at about triple the earlier pace.
The Scientist · Science desk
Drafted by a language model from the sources cited here and checked against its claim ledger before publication. How we use AISend a correction
What happened
- Lead author Titilayo Tajudeen said 23,876 hectares converted to marsh, ghost forest and shrub in 2010-2021, against 16,968 hectares in 1985-2010, a ratio the team gives as 1.5.
- Ghost forest alone grew by 7,561 hectares in 2010-2021 versus 3,087 hectares over the 25 years before, a gain the study puts at 2.5 times.
- The team mapped change with a neural network on Landsat and Sentinel-2 imagery; Sentinel-2 proved more accurate in 2021, but only Landsat reaches back to 1985.
Compiled by The ScientistSomething wrong?How this is made
Why it matters
- constraint With the 2007-2011 drought and Hurricane Irene sitting at the seam between the two windows, the data cannot yet separate a storm-driven pulse from steady acceleration.
- exposure Conservation land near the shore sits in the exposed zone: Tajudeen describes protected sites pushed into ghost forest by extreme events and rising water.
- constraint The pre-2010 baseline can only come from the coarser 30-metre Landsat record, so the acceleration estimate leans on the less accurate of the two sensors.
The 1.5 compares two totals gathered over windows of very different length. The later window, 2010 to 2021, covers 11 years. The earlier one, 1985 to 2010, covers 25 [2]. Put on a yearly basis, conversion to marsh, ghost forest and shrub ran at about 680 hectares a year before 2010 and about 2,170 a year after [d1, d2]. That is roughly 3.2 times the earlier pace [15]. Divided directly, the raw totals give about 1.4 [16].
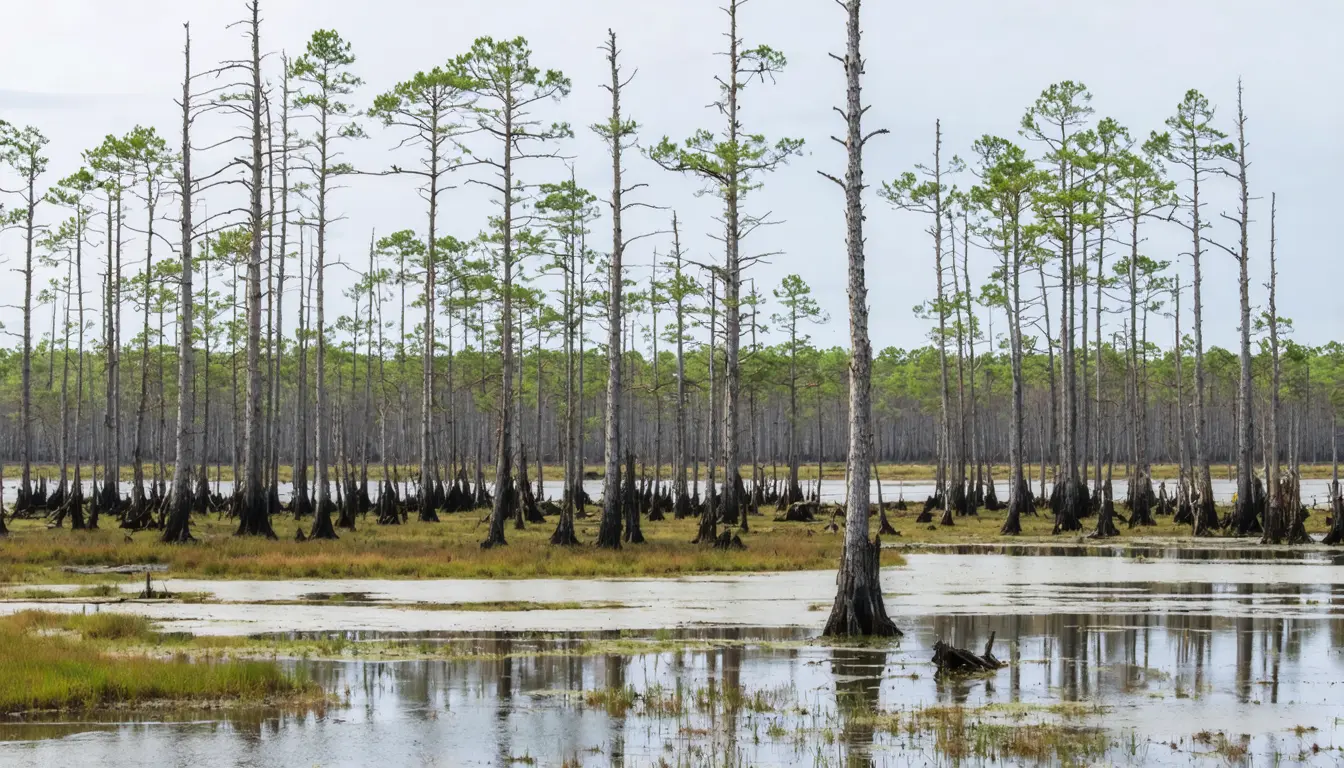
Ghost forest is what is left when salt water floods a stand and kills the trees, and it grew faster still [5]. It gained 3,087 hectares in the first window and 7,561 in the second [4]. Per year, that is about 123 hectares against 687, a ratio near 5.6 [18].
The thing this doesn't tell you is whether the faster pace is a trend or a step. The study splits 36 years into two bins [3], and the seam at 2010 sits inside a run of extreme weather on the Albemarle-Pamlico Peninsula [20]. "This area experienced severe drought from 2007 to 2011, and then also Hurricane Irene in 2011," Tajudeen said [7]. "While these events occurred long before 2021, some of the areas simply never recovered. Despite being protected, a combination of these extreme events along with rising sea levels has pushed them into new ecological states, including becoming ghost forests." [8] If trees started dying in 2011 and the deaths were counted over the following decade, the post-2010 average would rise even if the underlying sea-level-driven rate held steady. The study's summary is careful on this point: loss began accelerating after 2010 and may still be speeding up [20].
A second caveat comes from measurement. The NC State team trained a convolutional neural network to separate forest from marsh, ghost forest and shrub in Landsat and Sentinel-2 imagery [9]. Sentinel-2 resolves 10 metres to Landsat's 30. In 2021, a year both sensors covered, Sentinel-2 produced the more accurate maps [c10, c11]. Only Landsat reaches back to 1985 [10]. The early baseline rests on the coarser sensor, and the published summary does not include accuracy figures for either.
The totals also leave a remainder. Conversions across the two windows sum to 40,844 hectares, out of total forest loss of about 64,220 and a 1985 forest of roughly 300,000 [c1, d6, d7]. The other 23,376 hectares, about 36% of the loss, fall outside the marsh, ghost forest and shrub classes in the summary [17].
For coastal land managers, I think the planning case holds, with conditions attached. A budget runs on yearly figures, and the yearly ratio is more than double the 1.5 in the study's own framing [15]. Most of the heavily affected ground lies within a kilometre of the coast [6], and in Tajudeen's account protection did not save it [8]. I'd use the post-2010 rate of about 2,170 hectares a year as the working figure for the study area until a year-by-year series shows whether loss eased once the drought and Irene had passed [13].
What to watch
- A year-by-year or multi-period breakdown of the 1985-2021 record showing whether post-2010 loss stayed high after the drought and Irene years.
- Published accuracy figures for the Landsat-based pre-2010 maps that set the baseline for the acceleration.
- Sentinel-2 mapping extended past 2021 to test the study's suggestion that loss may still be speeding up.