ScienceNot yet confirmed elsewhere1 publisher2 min readPublished
Handwritten DRC weather sheets show Congo Basin hot days nearly doubled between the 1960s and 1980s
Vrije Universiteit Brussel researchers digitized weather sheets from 37 DRC stations and found hot days nearly doubled between the 1960s and 1980s. The Earth System Dynamics paper is the first to document hot-extreme changes in the basin since the 1960s, its authors say.
The Scientist · Science desk
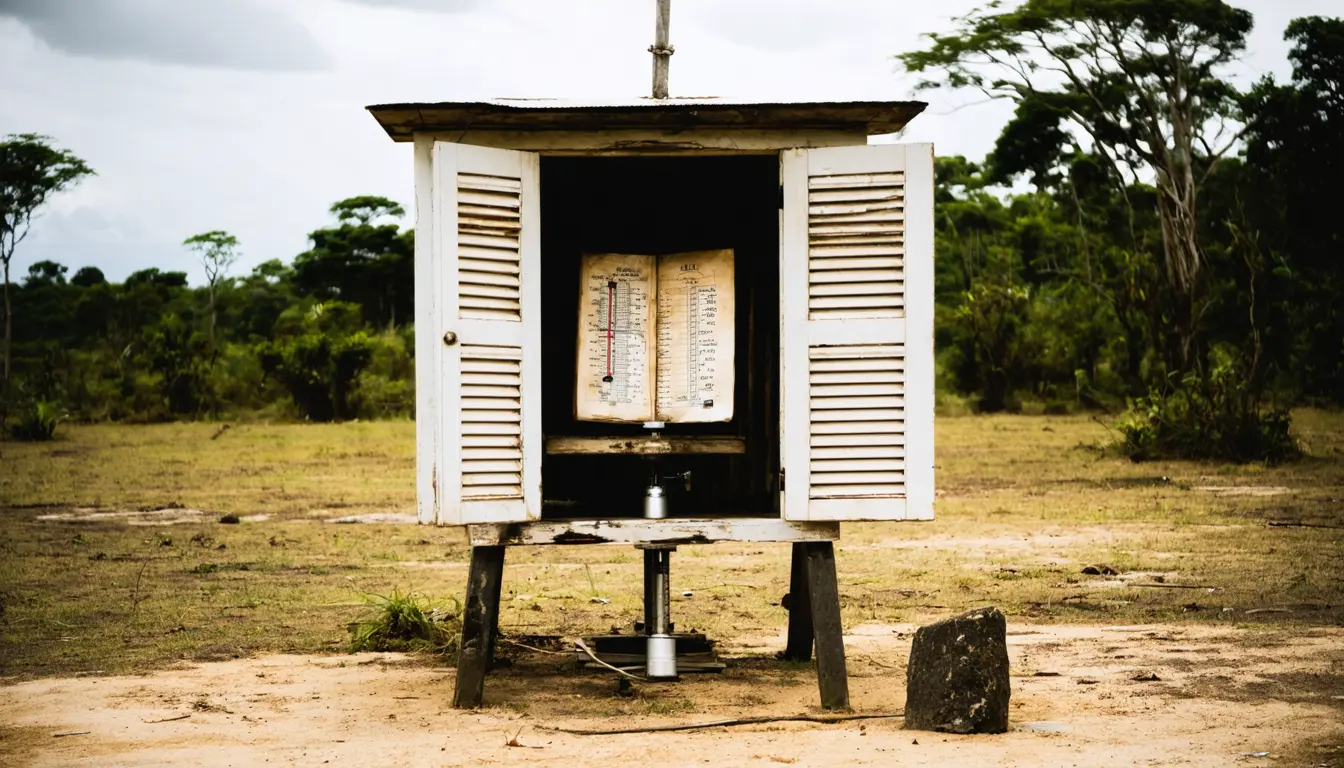
Three key figures. Maximum temperatures warmed about 0.7 °C over 1961-1990; minimum rose 0.3 °C, average 0.5 °C. More than 9,000 handwritten monthly sheets from 37 stations were photographed, yielding more than 1 million daily observations.
| Figure | Value | Note | Claim |
|---|---|---|---|
| Max temperature rise, 1961-1990 | 0.7 °C | About; min rose 0.3 °C, average 0.5 °C | 6 |
| Handwritten monthly sheets | 9,000 sheets | More than; from 37 DRC stations | 3 |
| Daily weather observations | 1,000,000 observations | More than; some are subdaily | 5 |
What happened
- In two field campaigns in 2023, Derrick Muheki, INERA staff and Ghent University photographed more than 9,000 handwritten monthly sheets of observations.
- The resulting database holds more than 1 million daily and sometimes subdaily observations and, with previously rescued data, is among the largest climate data sets for the region.
- Heavy rainfall events doubled in the 1980s compared with the 1960s at two of the three stations examined for rainfall.
Why it matters
- capability Modelers working on Central Africa now have a station record to test their simulations against, which the authors say will help evaluate and improve regional climate models.
- constraint The doubling describes the 1960s against the 1980s, so it is not a current hot-day frequency; for later years the account says only that warming continues at stations with longer records.
- precedent MeteoSaver is open source, so other archives can copy the photograph-then-transcribe workflow, and senior author Wim Thiery argues for more rescue projects in data-sparse regions.
The doubling compares two decade averages: hot days per year in the 1960s against the 1980s [8]. The thing this doesn't tell you is how large either average is. The phys.org account does not give the hot-day threshold, an uncertainty range, or how many of the 37 photographed stations [3] fed each decade's count.
This is archival work, so there is no control arm. The check is whether the pattern agrees with other evidence, and the authors say it does: each successive decade shows more hot days, hotter hot days and fewer cold days, consistent with trends around the world [13]. The sheets came from the INERA archive in Yangambi and the State Archives of Belgium [2]. MeteoSaver, which Muheki developed at VUB with the Ghent University Centre for Digital Humanities, transcribed the photographs automatically [4].
The temperature figures can be put on a per-decade footing. Spread over the three decades of 1961-1990, the 0.7 degree Celsius rise in maximum temperature is about 0.23 degrees per decade [15]. It also exceeds the 0.3 degree rise in minimum temperature by 0.4 degrees [16]. If the same stations underlie both numbers, daily highs rose faster than daily lows. That inference is ours.
The rainfall comparison draws on three stations, a far smaller base than the 37 whose sheets were photographed. The authors call the increase in extreme weather consistent with trends around the world, and link those trends to rising global temperatures driven by continued fossil fuel emissions [18].
Wim Thiery, the senior author and a VUB professor, said: "This is particularly important because Central Africa remains one of the few regions where the last Intergovernmental Panel on Climate Change (IPCC) report could not confirm an increase in hot extremes, largely due to the lack of past observations and scientific studies." [11]
Derrick Muheki, the lead author, described what he found at INERA. "Just months before my visit, part of the archive had been damaged by fire," he said [10].
What to watch
- The full Earth System Dynamics paper, for the hot-day threshold, the station count behind each decade and any uncertainty range around nearly doubled.
- Hot-day counts for the 1990s and 2000s from the longer-record stations, which would show whether the increase kept going after the 1980s.
- Further rescue campaigns at INERA or other African archives that apply MeteoSaver to sheets not yet photographed.
Clarity's read
What the record supports and how the coverage leans. The claims behind it follow.
Reality
- Evidence58
- Adoption
- Insufficient
- Hype gap+10
- Incentives
- Insufficient
- Confidence50
Claim ledger
Ranked by verification strength, evidence, and original report placement.
- [1]
New research led by Vrije Universiteit Brussel (VUB), published in the journal Earth System Dynamics, shows a clear warming signal across the Congo Basin since the 1960s using historical weather records from the DRC.
- [2]
The records come from the paper archives of the Institut National pour l'Etude et la Recherche Agronomiques (INERA) in Yangambi, DRC, and the State Archives of Belgium.
- [3]
During two field campaigns in 2023, Derrick Muheki of VUB, with INERA staff and Ghent University, photographed more than 9,000 handwritten monthly sheets of weather observations recorded at 37 stations across the DRC.
- [4]
MeteoSaver, open-source software developed by Muheki at VUB with the UGent Centre for Digital Humanities, automatically transcribed the observations into digital spreadsheets.
- [5]
The resulting database contains more than 1 million daily (and sometimes subdaily) weather observations that, together with previously rescued data, represent one of the largest climate data sets for the Congo Basin region.
- [6]
During 1961-1990, maximum temperatures warmed by about 0.7 degrees Celsius, minimum temperatures by 0.3 degrees and average temperatures by 0.5 degrees.
- [7]
Data from weather stations with longer records show that the warming of the Congo Basin continues into the 2000s.
- [8]
On average, the number of hot days per year nearly doubled between the 1960s and the 1980s.
- [9]
The open-access database provides important information to evaluate and improve climate models in the region.
- [10]
Just months before my visit, part of the archive had been damaged by fire.
ReportedSupportedSource: Derrick Muheki, lead author and VUB doctoral researcher, saidView cited source - [11]
This is particularly important because Central Africa remains one of the few regions where the last Intergovernmental Panel on Climate Change (IPCC) report could not confirm an increase in hot extremes, largely due to the lack of past observations and scientific studies.
- [12]
Thiery said the work highlights the urgent need for more data rescue projects, especially in data-sparse regions, to close knowledge gaps on climate trends.
- [13]
Each successive decade shows an increase in the number of hot days per year, with hot days getting hotter, while the number of cold days decreases, consistent with trends around the world.
- [14]
The authors document for the first time changes in hot extremes in the Congo Basin since the 1960s.
- [15]
The 0.7 degree Celsius rise in maximum temperature over 1961-1990 is about 0.23 degrees per decade.
- [16]
Maximum temperature warming over 1961-1990 exceeded minimum temperature warming by about 0.4 degrees Celsius.
- [17]
From three weather stations examined for rainfall, the number of heavy rainfall events at two of the stations doubled in the 1980s compared with the 1960s.
- [18]
The observed increase in the frequency and intensity of extreme weather events in the DRC is consistent with trends around the world, linked to increasing global temperatures driven by continued fossil fuel emissions.
Sources
1 independent publisher whose own reporting we read for this story.
Topics and entities
Follow any of these and your For You feed starts watching them — no settings page required.
Entities
- Vrije Universiteit BrusselFollow
- MeteoSaverFollow
- INERAFollow
- Earth System DynamicsFollow
- Intergovernmental Panel on Climate ChangeFollow
- Ghent UniversityFollow
- Derrick MuhekiFollow
- Wim ThieryFollow