Science1 publisher3 min readPublished
Study puts four missing climate feedbacks at 0.2 to 0.4 C of extra warming by 2100
A paper in Environmental Research Letters estimates that permafrost, wildfire, wetland and inland-water emissions amplify human-caused warming by 20 to 30 percent, though at one standard deviation the low-emissions case still runs from zero to 0.4 C.
The Scientist · Science desk
What happened
- A new Environmental Research Letters paper, billed as the largest effort yet to combine four feedbacks, quantifies the carbon dioxide and methane released by permafrost thaw, wildfires, wetlands and inland waters as the planet warms.
- It estimates that these releases add about 0.2 C of warming by 2100 under the lower-emissions SSP1-2.6 pathway even after human emissions reach net-zero, and about 0.4 C under SSP4-6.0, each with a one-standard-deviation spread of plus or minus 0.2 C.
- Permafrost thaw accounts for half of the anticipated warming-induced emissions, according to co-author Christina Schaedel of the Woodwell Climate Research Center.
Compiled by The ScientistSomething wrong?How this is made
Why it matters
- constraint If the multiplier holds up, the constraint that tightens is the carbon budget behind the temperature curve: the same target would require deeper cuts than the budgets governments are working from currently imply.
- capability Because the natural releases track human-caused warming rather than running independently, the lever that reduces them is one already in use, and each avoided tenth of a degree buys down two terms instead of one.
- exposure Any plan calibrated to Earth system model output inherits the same omission, which puts national targets and corporate net-zero pathways in the position of having priced a warming response that is missing a component.
- precedent Once an assessment body carries a feedback term, every target derived downstream of it inherits the number, which is why how the model comparison resolves matters more than any one estimate published now.
Percentages need a denominator, and this one is not stated. The paper reports both an amplification of roughly 20 to 30 percent [2] and an addition of 0.2 C to 0.4 C on top of human-caused warming this century [3]. Divide the small addition by the large percentage and the large addition by the small one, and the implied baseline warming that the percentage is measured against falls somewhere between about 0.67 C and 2.0 C [17]. That is a wide door. The tenths of a degree are the figure worth carrying.
The spread is quoted tightly. Under the lower-emissions SSP1-2.6 pathway the estimate is 0.2 C by 2100 with a one-standard-deviation uncertainty of plus or minus 0.2 C [4], which puts that band at 0.0 to 0.4 C [15]. Under SSP4-6.0 the central estimate is 0.4 C with the same spread [5], a band of 0.2 to 0.6 C [16]. One standard deviation is the narrowest conventional way to report uncertainty; widen it to two and the plus or minus 0.2 C becomes plus or minus 0.4 C [18]. The central estimates remain the paper's best guess. What the band tells you is the precision at which they can be used, and that precision falls short of what a line item in a carbon budget needs.
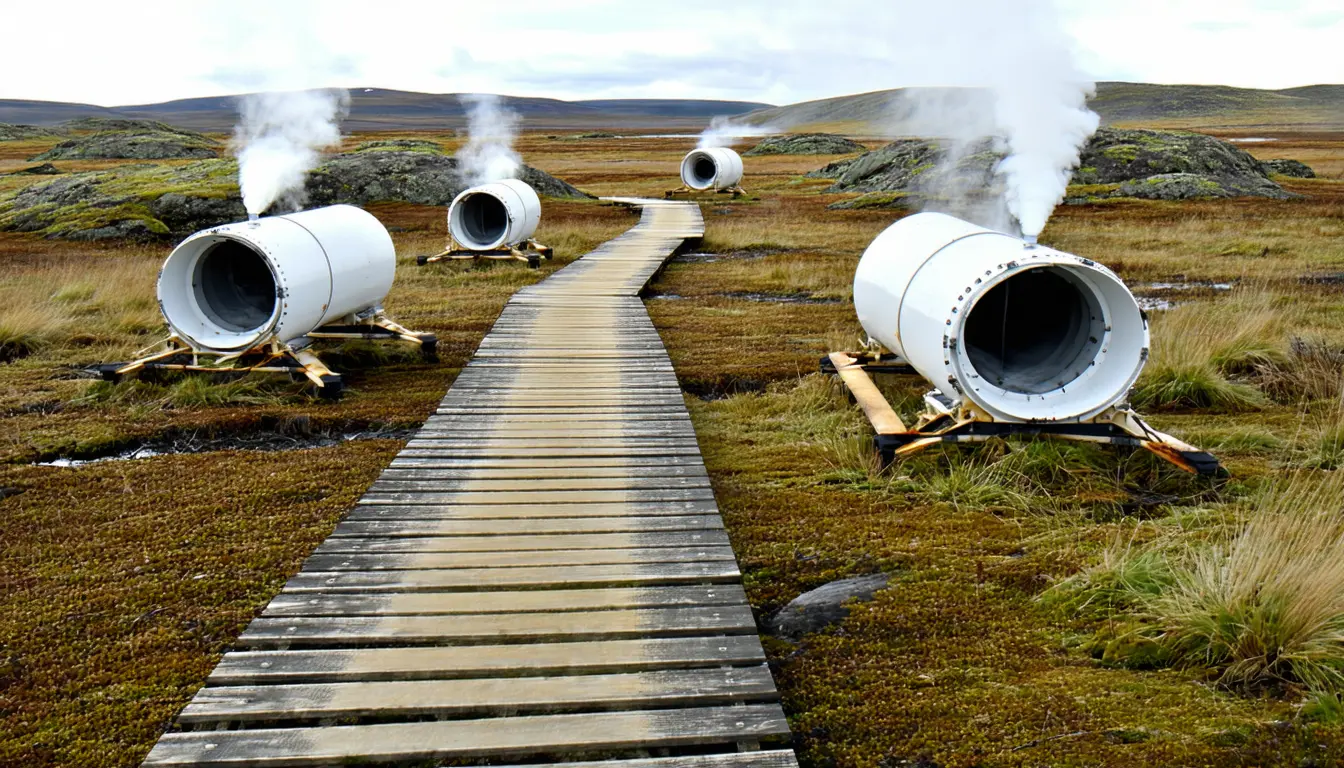
Permafrost carries half of the total, according to co-author Christina Schädel [13], and the four processes keep different clocks. Thawed ground decomposes organic matter that had been out of circulation for a very long time; wetlands and lakes give up more methane as they warm, especially in the tropics; drier conditions feed bigger fires that burn through carbon stored in forests [8]. Those four mechanisms are folded into one aggregate number, and the announcement does not break out the other three.
Everything rests on the claim that these terms are largely absent from most Earth system models used to translate human emissions into temperature [9]. "Largely" and "most" are doing work in that sentence. If some models already carry partial wetland or fire responses, adding the full 0.2 C to their output double counts, and the summary does not say which models include what. The author list spans Stanford, Spark Climate Solutions, the Environmental Defense Fund and the Woodwell Climate Research Center [7], and the same community is now comparing rival models of warming-induced emissions and pressing for the term to appear in IPCC assessments [10]. That intercomparison, not this single synthesis, is what would make the number usable.
The most operationally useful finding is the proportionality: the natural releases scale with human-caused warming, so declining direct emissions bring them down too [11]. That makes this a multiplier on a quantity policy already controls rather than an independent runaway. It is also why lead author Sam Abernethy of Spark Climate Solutions frames the problem as an overestimate of how much carbon can still be emitted rather than as a wrong temperature curve [12]. Robert Jackson of Stanford, who chairs the Global Carbon Project, wants the figures in the next generation of climate policies [14]. The budget arithmetic is where a correction of this size would bite, and doing that arithmetic honestly needs a spread narrower than the one currently on offer.
What to watch
- Whether the model intercomparison now being organised converges near 0.2 to 0.4 C or spreads wider than the single-paper estimate.
- Whether IPCC assessment processes adopt a warming-induced emissions term, and whether it is applied to carbon budgets or only to temperature projections.
- A breakout of the three non-permafrost feedbacks, since permafrost carries half the total and the remainder is currently one lumped figure.