US oil and gas methane stayed flat through a production rise, satellite estimates show
Johns Hopkins researchers estimate US oil and gas methane stayed within 9.3 to 10.4 teragrams a year from 2019 to 2024 as production rose. They found no detectable drop after the Inflation Reduction Act. The pipeline explanation is hedged.
The Scientist · Science desk
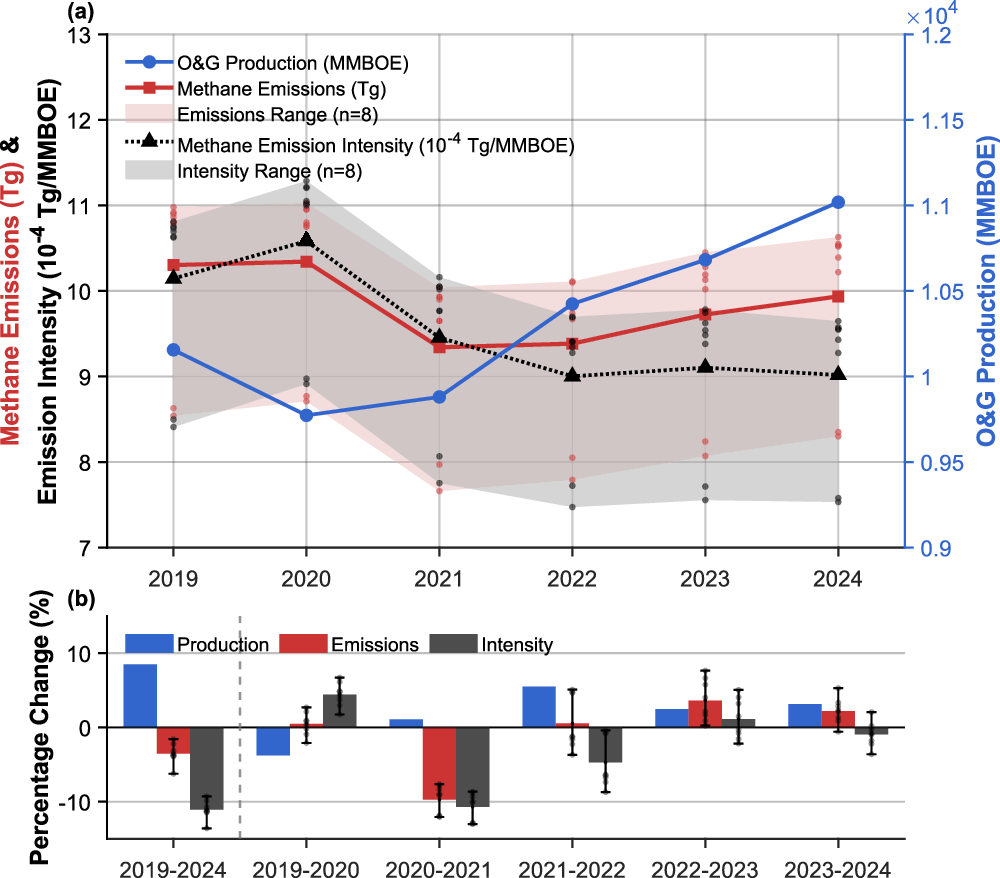
Three figures: emissions intensity, methane relative to oil and gas production, fell about 11%; emissions fell by 0.58 Tg from 2019 to 2023, then rose slightly from 2023 to 2024; yearly totals stayed between 9.3 and 10.4 Tg over 2019-2024.
| Figure | Value | Note | Claim |
|---|---|---|---|
| Fall in methane relative to oil and gas production | 11% about | 4 | |
| Emissions fall, 2019-2023 | 0.58 Tg | 3 | |
| Yearly total, 2019-2024 | 9.3 to 10.4 Tg | 2 |
What happened
- Emissions fell by 0.58 Tg from 2019 to 2023 and then rose slightly from 2023 to 2024.
- Emissions intensity, methane relative to production, fell about 11%; the researchers called that the continuation of a decades-long trend.
- The team combined TROPOMI and GOSAT satellite data with atmospheric modeling and an algorithm that traced methane back to its sources on the ground.
- The EPA restarted methane rulemaking in 2021, and the 2022 Inflation Reduction Act added emissions fees and more than $1 billion in technical support.
Why it matters
- constraint The researchers describe the rules as short-lived, so the window for detecting a policy effect is brief, and a null result here is weak evidence about what longer enforcement would do.
- decision Where gas is flared for lack of a pipeline, the study's logic points to takeaway capacity as an emissions lever, though the evidence offered for it here is indirect.
- capability Satellite observations paired with an algorithm that traces gas to its sources let researchers test national policy against measured emissions, so later rules can be checked the same way.
The researchers measured the flat total, but their explanation for it rests largely on reasoning about incentives. The account of the study lists the build-out of capture and transport infrastructure as one reason emissions held steady, since it gives companies a financial incentive to limit what escapes [15]. The researchers say the gradual decline in emissions intensity may reflect better industry practices as methane moved from a side product of oil extraction to a valuable consumer product [16].
Where no pipeline reaches a well, drillers have less reason to prevent leaks and instead flare the gas [17]. When pipelines arrived in regions such as West Texas, that gas moved to market [18], and evidence from other studies suggests that leaks decline when gas becomes a valuable commodity [19]. The satellite analysis itself estimated where emissions occurred and how large they were [5]. As described, the pipeline link comes from the incentive logic and from those other studies. In our view, "largely because" is stronger than the authors' own wording supports.
On policy, the authors are direct. "We don't see a detectable decrease in emissions after the Inflation Reduction Act," said Ao Chen, the paper's first author and a doctoral student at Johns Hopkins [11]. Chen also said: "Of course, there's no way to test the counterfactual. It's possible that without the Inflation Reduction Act, methane emissions would be much higher." [12] The account does not quantify how much of the flat line the pipelines explain.
Yearly totals for the contiguous US stayed inside a band 1.1 Tg wide [9], and the 0.58 Tg decline between 2019 and 2023 is a little over half that width [10]. Scot Miller, the senior researcher and an associate professor of environmental health and engineering, framed the result in two halves. "This is a good news/bad news situation. The good news is that emissions have not markedly increased, as many scientists feared would happen after an enormous increase in natural gas production in the decades following the hydraulic fracturing boom," Miller said [13]. Miller went on to say: "The bad news is that oil and gas production is still a large percentage of U.S. methane emissions, and we do not find any evidence that a flurry of federal legislation had an impact on emissions." [14]
Miller said methane is nearly 30 times more potent than carbon dioxide and has a shorter lifespan [7].
What to watch
- Whether the slight rise from 2023 to 2024 continues in later years of the satellite record.
- A study that tests the pipeline explanation directly, for example by comparing basins with and without takeaway pipelines.
- A policy test with a longer post-rule window, since the rules examined here were short-lived.
Clarity's read
What the record supports and how the coverage leans. The claims behind it follow.
Reality
- Evidence58
- Adoption
- Insufficient
- Hype gap−10
- Incentives
- Insufficient
- Confidence55
Claim ledger
Ranked by verification strength, evidence, and original report placement.
- [1]
Methane emissions from the US oil and gas sector held steady even as oil and gas production increased during a recent period of heightened regulations, according to new Johns Hopkins University research published in Communications Earth & Environment.
- [2]
Total methane emissions from oil and gas activities for the contiguous US remained between 9.3 teragrams and 10.4 Tg each year over 2019-2024.
- [3]
Emissions decreased by 0.58 Tg from 2019 to 2023 but rose slightly from 2023 to 2024.
- [4]
The intensity of emissions, meaning methane emissions relative to oil and gas production, decreased by about 11%, which the researchers said was a continuation of a decades-long trend and not a significant drop in emissions.
- [5]
The researchers combined satellite data (Europe's TROPOMI instrument and the GOSAT satellite) with atmospheric modeling and an algorithm that traced the gas back to sources on the ground, to estimate where oil and gas emissions occurred in the US and how large they were for 2019-2024.
- [6]
In 2021 the EPA restarted the process of developing methane rules under the Clean Air Act; Congress later enacted the Inflation Reduction Act of 2022, which established fees for methane emissions from oil and gas facilities and allocated more than $1 billion in technical support to the sector.
- [7]
Methane is nearly 30 times more potent and has a shorter lifespan than carbon dioxide, and is widely regarded as the second most important greenhouse gas to target for emissions monitoring and reduction.
- [8]
The regulations were short-lived, though an unprecedented push toward reducing methane emissions, the researchers said.
- [9]
The spread between the highest and lowest yearly totals is 1.1 Tg.
- [10]
The 0.58 Tg decline from 2019 to 2023 is about 53% of the 1.1 Tg spread between the highest and lowest yearly totals, a little over half.
- [11]
"We don't see a detectable decrease in emissions after the Inflation Reduction Act," said Ao Chen, a Ph.D. student at Johns Hopkins and first author of the paper.
- [12]
"Of course, there's no way to test the counterfactual. It's possible that without the Inflation Reduction Act, methane emissions would be much higher."
- [13]
"This is a good news/bad news situation. The good news is that emissions have not markedly increased, as many scientists feared would happen after an enormous increase in natural gas production in the decades following the hydraulic fracturing boom," said senior researcher Scot Miller, an associate professor of environmental health and engineering at Johns Hopkins.
- [14]
"The bad news is that oil and gas production is still a large percentage of U.S. methane emissions, and we do not find any evidence that a flurry of federal legislation had an impact on emissions."
- [15]
One reason emissions held steady: companies have built more infrastructure needed to better capture methane and transport it for sale as fuel, providing a financial incentive to limit the amount escaping into the atmosphere.
- [16]
The gradual decrease in emissions intensity may reflect better industry practices as methane transitioned from a side product of oil extraction to a valuable consumer product, the researchers said.
- [17]
When there is no pipeline to bring natural gas from the well to market, drilling companies have less incentive to prevent leaks and instead flare the gas to get rid of it.
- [18]
When pipeline infrastructure became available in regions like West Texas, that gas moved to market.
- [19]
Evidence from other studies suggests that leaks decline when gas becomes a valuable commodity.
Get this ledger inside ChatGPT. Ask about any of our stories and the answer brings its figure, each claim’s verdict and the sources. Free, no account.
Sources
1 independent publisher whose own reporting we read for this story.
- phys.orgU.S. methane emissions flatline, despite increases in oil and gas production
1 article · October 14, 2026
Topics and entities
Follow any of these and your For You feed starts watching them — no settings page required.