Postharvest losses in the Global South are hard to size because 324 studies measure them differently
Researchers who reviewed 324 studies of Global South postharvest losses found the evidence fragmented and measured inconsistently. Research also concentrates on storage of maize, rice and pulses, so fruits, vegetables, roots and tubers have evidence gaps.
The Scientist · Science desk
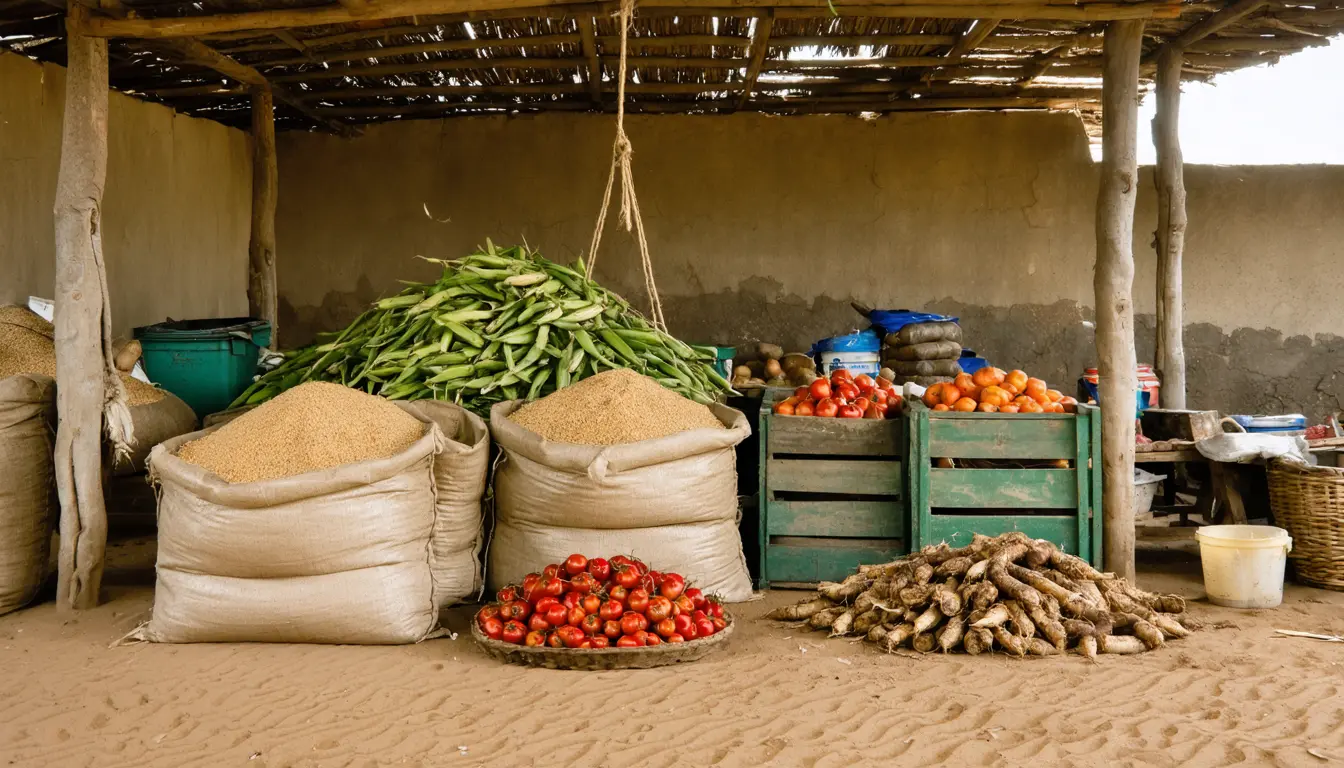
Key figures: estimated postharvest losses without interventions are about 42.9% for roots and tubers and about 35.1% for vegetables, both food groups the review lists among its evidence gaps, and about 27.7% for cereals.
| Figure | Value | Note | Claim |
|---|---|---|---|
| Roots and tubers, estimated loss without interventions | 42.9% lost, about | an evidence gap in the review | 16 |
| Vegetables, estimated loss without interventions | 35.1% lost, about | an evidence gap in the review | 16 |
| Cereals, no interventions | 27.7% lost, about | 7 |
What happened
- The review put losses without interventions at roughly these levels: cereals at 27.7%, vegetables at 35.1%, fruits at 25.8%, and roots and tubers at 42.9%.
- Measures such as hermetic storage, cold chains and better packaging brought those estimates down to about 8.2%, 7.3%, 6.2% and 11.5%.
- Losses were rarely traced to one cause; the authors found infrastructure, technology, environment, finance and market constraints interlinked.
Why it matters
- constraint Governments cannot target investment without knowing where losses occur and how large they are, and the authors say that needs standardized, region- and commodity-specific measurement.
- contradiction The food groups with the two highest estimated losses are also groups the review lists as evidence gaps, so the largest estimates sit where the research is thinner.
- decision The authors argue that roads, storage, processing facilities and cold chains belong to the food-production system, so spending on them becomes a production decision.
Losses happen at harvesting and handling, in transport, in storage, in processing and at market [10]. The studies in the review are spread across those stages, across commodities, and across indicators and methods [4]. A storage-loss rate for maize and a loss rate for a vegetable carried over poor roads to market are different quantities, and in our view a regional total built from both would mix unlike things. The authors give measurement differences as the reason the true scale is difficult to estimate [3].
The before-and-after figures look tidy. Subtracting, mitigation takes 19.5 percentage points off cereals, 27.8 off vegetables, 19.6 off fruits and 31.4 off roots and tubers [17]. As a share of each starting estimate, the cuts are 70%, 79%, 76% and 73% [18]. Four different food groups land within nine points of one another.
The thing this doesn't tell you is how many of the 324 studies sit behind each pair of figures, or whether each pair compares the same sites. The summary does not say. The authors themselves wrote: "These figures illustrate the scale of variation and the potential for reduction." [9]
The authors list poor roads, inadequate warehouses, limited cold storage and inefficient transport as separate routes to physical damage and spoilage [12]. We think that matters for reading the intervention numbers. A cold store does little for a crop already bruised on the way to it, so a figure for one measure tested alone is a weak guide to what a package of measures delivers.
The one-third figure the authors open with is a global estimate of food lost or wasted [1]. The review covered postharvest losses in the Global South [2], so it neither confirms nor tests that number [15].
What to watch
- Whether national statistical offices or agricultural research institutions adopt a common loss-measurement method that studies can be compared against.
- New studies on fruits, vegetables, roots and tubers that measure losses across several value-chain stages, which would test the highest estimates in this review.
- Trials that report loss with and without a mitigation package on the same sites, which would show how the review's before-and-after gap holds up.
Clarity's read
What the record supports and how the coverage leans. The claims behind it follow.
Reality
- Evidence55
- Adoption
- Insufficient
- Hype gap+10
- Incentives
- Insufficient
- Confidence60
Claim ledger
Ranked by verification strength, evidence, and original report placement.
- [1]
Globally, about one-third of food produced for human consumption is estimated to be lost or wasted.
- [2]
The authors examined 324 studies on the scale, causes and drivers of postharvest losses across food commodities and regions of the Global South, in a recent Advances in Agriculture paper.
- [3]
The authors found the evidence is fragmented and uneven, and estimating the true scale of postharvest losses is difficult because studies measure losses differently.
- [4]
The studies examine different commodities and different stages of the value chain and use different indicators and methods.
- [5]
Research has concentrated heavily on storage losses in major staples such as maize, rice and pulses.
- [6]
The concentration on staple storage has left evidence gaps for fruits, vegetables, roots and tubers, animal products and other foods.
- [7]
Without interventions, estimated losses were about 27.7% of cereals, 35.1% of vegetables, 25.8% of fruits and 42.9% of roots and tubers.
- [8]
With mitigation measures such as improved harvesting and handling, hermetic storage, cold-chain infrastructure, better packaging, and enhanced processing and transportation, losses fell to about 8.2% (cereals), 7.3% (vegetables), 6.2% (fruits) and 11.5% (roots and tubers).
- [9]
The authors wrote: "These figures illustrate the scale of variation and the potential for reduction."
- [10]
Postharvest losses occur throughout the food supply chain, from harvesting and handling to transportation, storage, processing and marketing.
- [11]
Postharvest losses are rarely caused by a single factor; the study identified interconnected infrastructure, technological, environmental, financial and market constraints.
- [12]
Poor roads, inadequate warehouses, limited cold storage and inefficient transport expose food to physical damage and spoilage.
- [13]
Before governments can decide where to invest, they need reliable information about where losses occur and how large they are; standardized, region- and commodity-specific measurement methods would make evidence more comparable and help governments target resources.
- [14]
Storage facilities, rural roads, processing facilities and cold chains are not secondary agricultural infrastructure; the authors say they are part of the food-production system.
- [15]
The review covers postharvest losses in the Global South, whereas the one-third figure is a global estimate of food lost or wasted, so the review neither confirms nor tests that figure.
- [16]
The two highest no-intervention loss estimates, roots and tubers (42.9%) and vegetables (35.1%), are for food groups that the review lists among its evidence gaps.
- [17]
Mitigation lowers estimated losses by 19.5 percentage points for cereals, 27.8 for vegetables, 19.6 for fruits and 31.4 for roots and tubers.
- [18]
As a share of each no-intervention estimate, the reductions are about 70% (cereals), 79% (vegetables), 76% (fruits) and 73% (roots and tubers), a spread of about nine points.
Get this ledger inside ChatGPT. Ask about any of our stories and the answer brings its figure, each claim’s verdict and the sources. Free, no account.
Sources
1 independent publisher whose own reporting we read for this story.
- phys.orgOne-third of food is lost or wasted: How to help farmers cut postharvest losses
1 article · October 14, 2026
Topics and entities
Follow any of these and your For You feed starts watching them — no settings page required.
Topics
- Postharvest lossesFollow
- Food SecurityFollow
- Agricultural infrastructureFollow