BuildNot yet confirmed elsewhere1 publisher3 min readPublished
Copilot is now the minority tool, and your 2025 standardization decision knows it
A dev.to read of JetBrains' 10th Developer Ecosystem Survey puts Claude Code at 39% of workplace use against Copilot's 21%. The rate of change matters more than the rank.
The Engineer · Build desk
What happened
- JetBrains collected more than 15,000 valid responses from professional developers between May and July 2026 for the 10th edition of its Developer Ecosystem Survey.
- Up to 90% of those respondents report using AI coding agents at least once a week.
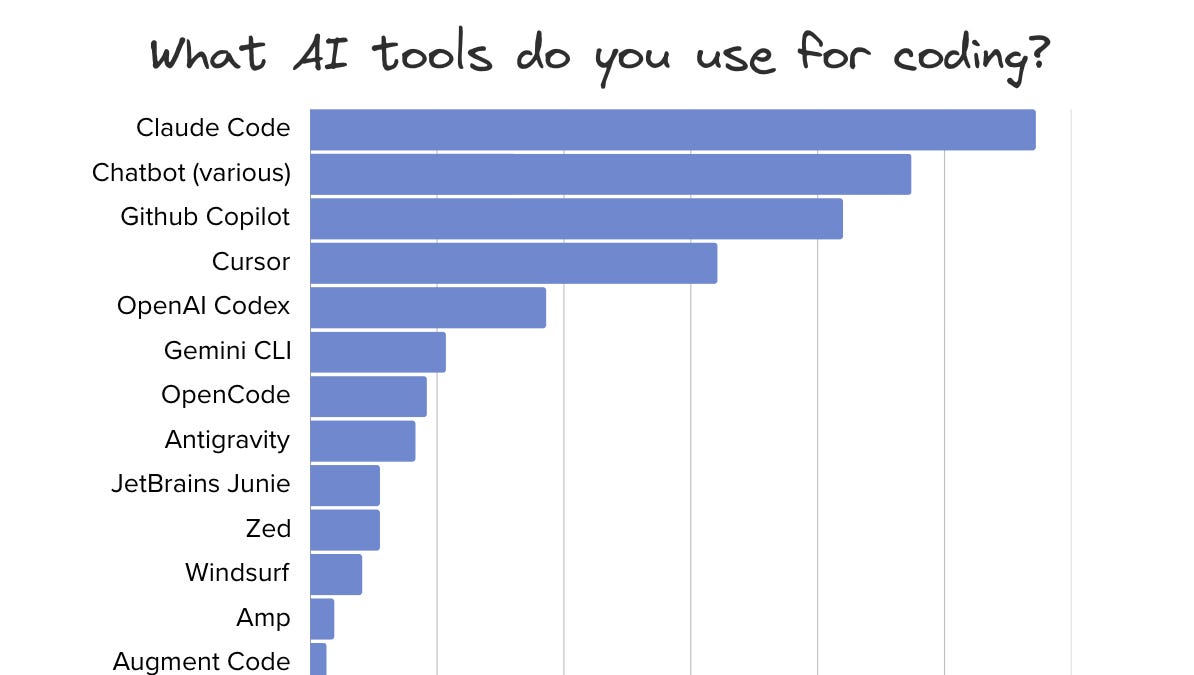
- Claude Code's reported workplace use went from 18% in January 2026 to 39% in the May-to-July wave, and it now leads Copilot in corporate settings.
- Copilot, steady between 29% and 31% from mid-2025 into early 2026, came in at 21%.
- Cursor's workplace use fell from 18% to 12% even as awareness of it rose to 75%.
Why it matters
- decision A Copilot standard signed against a steady 30% reading now blesses the tool most developers are not reaching for, so the next renewal has to be argued rather than rolled over.
- constraint Annual procurement cadence cannot track a ranking that reordered inside five months, which means any single-vendor commitment will outlive the evidence used to justify it.
- exposure Anyone putting these percentages into an internal business case is citing a secondary post that also sells an API gateway, not a JetBrains release they have read.
- capability Budget lines written as IDE seats do not buy agents that traverse repositories and run tests, so teams asking for that now have survey-scale backing rather than a preference.
Awareness is not the variable doing the work here. Claude Code and Copilot are known to the same 79% of respondents [9], so both draw from an identical pool of people who have heard of them. Convert it: 39 points of workplace use against 79 points of awareness puts Claude Code at 49% of the developers who know it exists, while Copilot converts 27% [14]. Codex turns 65% awareness into 16 points of use, about a quarter; Cursor manages 16% of its 75% [15]. Cursor's awareness went up while its workplace use went down [11], which is the shape of a tool people tried and then left out of their working set.
The renewal arithmetic is what should worry anyone holding a signed agreement. A Copilot standard set in mid-2025 was set on a number that had been sitting between 29% and 31% for months [8], and stability is precisely what a standardization committee buys. Twenty-one percent is nine points off that band's midpoint, a 30% relative decline, and the gap between the last stable reading and the new one is roughly five months [18].
Now add the four named tools: 39 plus 21 plus 16 plus 12 gives 88 points of workplace adoption against the 90% who use an agent weekly [16]. Since the same survey has open-source agents and other commercial products gaining ground too [19], that sum only balances if a good number of developers are running more than one tool at work. The standard is already plural at the desk, whatever the master agreement says.
All of this arrives second-hand. The figures are a dev.to analysis of JetBrains' data, and the same post pauses mid-argument to recommend an API gateway for organisations managing multiple model endpoints [4]. The headline number is written as "up to 90%" [3], which is a hedge, and the question wording behind it is not on the page. Weekly use of an agent is a low bar: one prompt on a Tuesday clears it, and the survey's own description of what agents do, reading whole repositories and running test suites [13], is a much higher one.
What the material supports is narrower and more useful than the rank order. The tool many organisations blessed about a year ago is now reported in use at work by one developer in five [8]; the one they did not bless is used by two in five, roughly 1.9 times as many [17], and 47% in the United States [7]. A procurement decision does not have to have been wrong to be stale. The cost of reopening it is a week of arguing, against a year of paying for seats that people are routing around.
What to watch
- Whether JetBrains publishes the question wording behind the 90%, which decides how much of it is autonomous execution and how much is ordinary completion.
- Whether Copilot's 21% is a floor or the first of consecutive declines; one reading is not a trend.
- Whether Claude Code eventually shows Cursor's pattern of rising awareness with falling workplace use once the novelty wave passes.
Clarity's read
What the record supports and how the coverage leans. The claims behind it follow.
Reality
- Evidence28
- Adoption42
- Hype gap+38
- Incentives66
- Confidence30
Claim ledger
Ranked by verification strength, evidence, and original report placement.
- [1]
JetBrains Research released its 10th annual Developer Ecosystem Survey, based on more than 15,000 valid responses from professional developers worldwide collected between May and July 2026.
- [2]
Respondents included software engineers, DevOps specialists, ML engineers, system architects and QA engineers.
- [3]
According to the survey, up to 90% of professional developers use AI coding agents at least on a weekly basis.
- [4]
The dev.to analysis of the survey recommends an API gateway product, 4sapi, for organisations managing multiple large-model endpoints for agent workloads.
- [5]
Claude Code has overtaken GitHub Copilot as the most-used AI coding tool in corporate settings.
- [6]
Claude Code workplace use rose from 18% of surveyed professionals in January 2026 to 39% in the May-July 2026 wave.
- [7]
In the United States, Claude Code workplace adoption reaches 47%.
- [8]
GitHub Copilot workplace usage stayed between 29% and 31% from mid-2025 to early 2026, then dropped to 21% in the May-July 2026 period.
- [9]
Awareness of both Claude Code and GitHub Copilot is comparable at 79% among all respondents.
- [10]
OpenAI Codex workplace use rose from 3% in January 2026 to 16% in mid-2026, with awareness rising from 27% to 65%.
- [11]
Cursor workplace adoption fell from 18% in January 2026 to 12% in the May-July round, while general awareness rose from 69% to 75%.
- [12]
Among Chinese developers, self-reported Cursor workplace usage dropped from 28% to 16% over the same timeframe.
- [13]
The source describes modern AI coding agents as able to read entire code repositories, perform iterative modifications, run test suites and complete end-to-end development tasks.
- [14]
Claude Code converts 49% of its awareness into workplace use; Copilot converts 27% of the same 79% awareness base.
- [15]
Codex converts 25% of its 65% awareness into workplace use; Cursor converts 16% of its 75%.
- [16]
The four named tools together account for 88 percentage points of workplace adoption, against 90% of developers using an agent weekly.
- [17]
Claude Code's 39% workplace share is about 1.9 times GitHub Copilot's 21%.
- [18]
Copilot's fall to 21% is 9 points below the 30% midpoint of its earlier 29-31% band, a relative decline of 30%, and the interval from the early-2026 stable reading to the May-July wave is roughly five months.
- [19]
The source states that open-source agent projects and competing commercial solutions are rapidly gaining market traction, moving competition from IDE-embedded completion to full-cycle agent execution.
Sources
1 independent publisher whose own reporting we read for this story.
- dev.toClaude Code Surpasses GitHub Copilot: 90% of Developers Adopt AI Coding
1 article · August 25, 2026
Topics and entities
Follow any of these and your For You feed starts watching them — no settings page required.
Topics
- Developer Survey DataFollow
- Enterprise Tooling StandardizationFollow
- AI Coding AgentsFollow
- Developer Tool AdoptionFollow