REDCAT reads metabolic state and cell identity off one section, in ratios not molecules
The Nature Methods platform pairs stimulated Raman imaging with CODEX typing, so metabolism stops being predicted from transcripts. Its redox proxy still cannot name the cause.
The Scientist · Science desk
What happened
- REDCAT is an all-optical platform that pairs Raman scattering microscopy with high-plex immunofluorescence to co-map metabolism and cell type in human tissue.
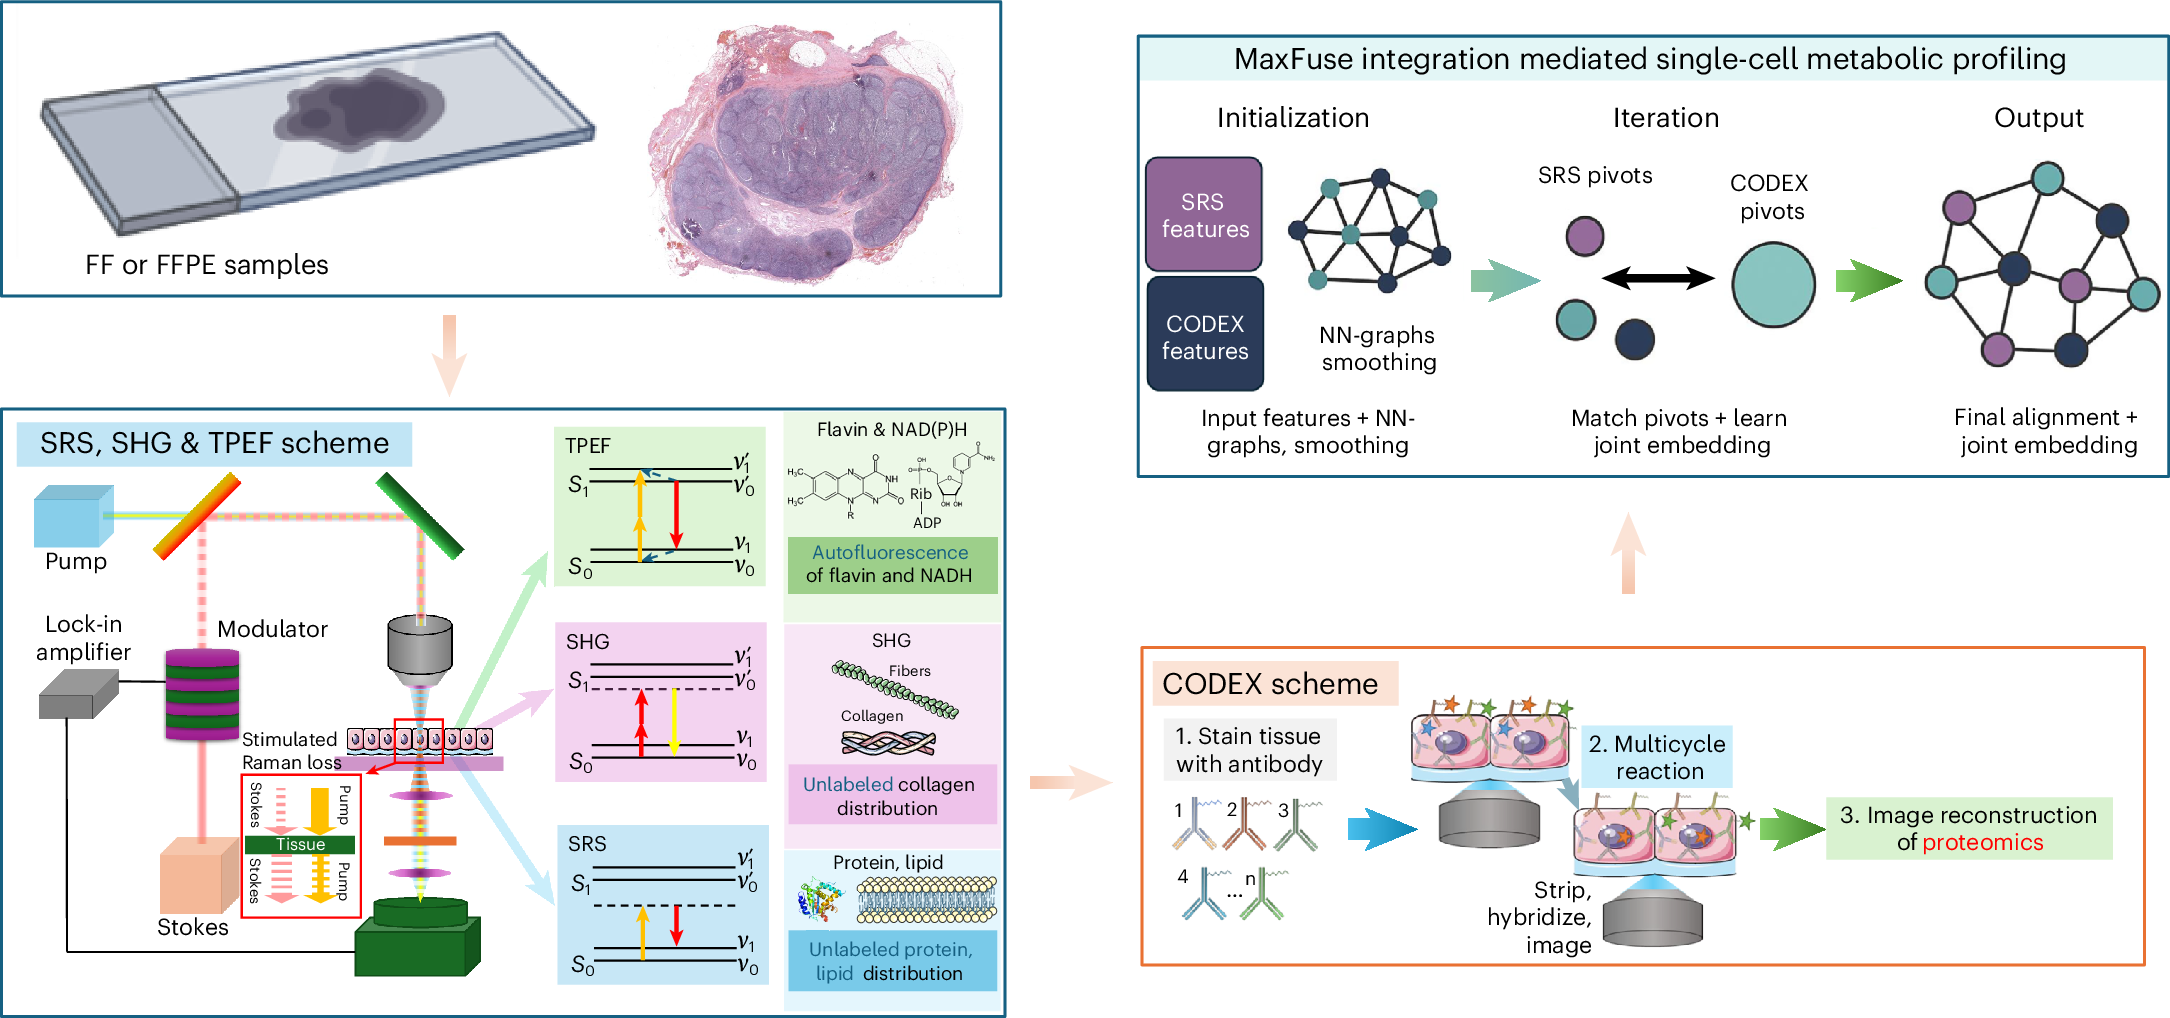
- The stack combines stimulated Raman imaging, two-photon excited fluorescence, second harmonic generation and CODEX antibody-based cell typing.
- A section about 10 micrometres thick on glass is imaged label-free first, with the multiplexed antibody typing done afterwards.
- It was run on human lymph node, lymphoma and normal liver, reporting cell-type specialization, tumour reprogramming and vein-to-vein zonation gradients.
Why it matters
- constraint A cell scored as more reduced cannot be called glycolytic on that evidence alone, so any diagnostic use needs a second, orthogonal assay to pin the cause.
- exposure Every cell-level metabolic call inherits the cross-modality match; a mismatch parks a metabolic state on the wrong cell type and then reads as biology in the figures.
- capability Because the assay accepts archival FFPE as well as fresh-frozen material, banked specimens become the sampling frame for metabolic questions instead of new prospective collections.
- decision Labs budgeting spatial metabolism work now have to decide whether naming metabolites by mass spec is worth more than class-level chemistry that arrives with cell identity.
The metabolic readout is a set of ratios rather than a list of identified molecules. Two-photon autofluorescence from reduced NAD(P)H and from oxidized flavins produces an optical redox ratio that the authors describe as a proxy for redox balance [10]. A higher value marks a more reduced cell, which the paper says is consistent with increased glycolysis and/or impaired oxidative phosphorylation [11]. That "and/or" is the part to hold onto: a cell running more glycolysis and a cell with damaged respiration can land on the same number, and the image will not separate them.
The Raman channels are class-level too. Pump tuning to 2,930 and 2,850 cm-1 gives protein and lipid, 3,015 and 2,880 cm-1 give unsaturated and saturated lipid, and what comes out are lipid/protein and lipid-saturation ratios [12]. All four points sit inside a 165 cm-1 window [20]. The contrast is background-free and proportional to concentration [16], which is what makes those ratios worth quoting, and hyperspectral SRS can yield fuller Raman-like spectra for molecular discrimination [18], so four-point sampling is a design decision rather than the limit of the technique.
Against transcript-based work the gain is that nothing is being predicted: spatial omics infer metabolic programs from transcripts or proteins and do not directly report dynamic metabolic state or robustly link activity to cell type [13]. Against mass spectrometry imaging the trade is explicit. MALDI, DESI and SIMS map identified molecular species and, paired with multiplex protein markers, reach high sensitivity [15]; they are also mostly destructive and often trade molecular coverage for spatial resolution, which the paper says limits longitudinal and multimodal measurement [14]. REDCAT reverses the priority, offering class-level chemistry at submicron resolution with cell identity attached [3].
Registration is where the claims are won or lost. The label-free imaging runs first, CODEX typing follows, and a pipeline built on MaxFuse matches the two and links single-cell protein markers to metabolic features [3]. MaxFuse was published for integrating modalities with weakly linked features [5], which names the difficulty rather than settling it. The label-free arm alone contributes seven contrast channels that all have to land on the same cell as the antibody panel [19], and the abstract and briefing available here carry no registration accuracy figure, so every per-cell metabolic assignment rests on a step whose error rate is unstated.
The liver demonstration recovers gradients running from central vein to portal vein [4], a geometry already known, which is what a method paper should show. The Nature Methods briefing accompanying the 2026 paper calls functional histopathology a suggested use [6][7], and suggested is the right tense. That briefing also cites DBiTplus, a separate 2026 effort to put imaging-based and sequencing-based spatial omics on the same section for clinical pathology [17]. One section carrying several assays is now the thing being competed over.
What to watch
- A published registration accuracy figure for the MaxFuse step, benchmarked cell by cell, which would set how much weight the per-cell metabolic assignments can carry.
- Anyone running REDCAT and then a mass spec or sequencing-based assay on the same section, which is the claim DBiTplus is chasing from the other direction.
- Validation of the optical redox ratio against an orthogonal metabolic measurement in a patient cohort rather than three tissue contexts.
Clarity's read
What the record supports and how the coverage leans. The claims behind it follow.
Reality
- Evidence58
- Adoption
- Insufficient
- Hype gap+14
- Incentives62
- Confidence61
Claim ledger
Ranked by verification strength, evidence, and original report placement.
- [1]
REDCAT (Raman Enhanced Delineation of Cell Atlases in Tissues) is an all-optical platform integrating Raman scattering microscopy and high-plex immunofluorescence to co-map metabolism and cell types, achieving subcellular profiling of protein, lipid, nuclear metabolites and redox metabolism in human tissues.
- [2]
REDCAT integrates SRS metabolomic imaging, two-photon excited fluorescence (TPEF), second harmonic generation (SHG) and highly multiplexed immunofluorescence cell typing via CODEX.
- [3]
A computational pipeline based on MaxFuse aligns the modalities and links single-cell protein markers to metabolic features, enabling submicron-resolution measurements of proteins, lipids, nuclear features and redox state.
- [4]
REDCAT was used on normal and malignant human lymphoid tissues and normal human liver, revealing cell-type-specific metabolic specialization in lymph nodes, reprogramming and transitional states in lymphoma, and zonation-dependent gradients from the central vein to the portal vein in liver.
- [5]
MaxFuse, reported by Chen et al. in Nature Biotechnology 42, 1096-1106 (2024), integrates spatial and single-cell data across modalities with weakly linked features, and is used and expanded in REDCAT for data registration and integrative analysis.
- [6]
The Nature Methods briefing states that REDCAT resolved metabolic features in normal lymph nodes, uncovered lipid-redox remodeling in lymphoma and exposed intratumoral heterogeneity, suggesting a use in functional histopathology.
- [7]
The REDCAT paper is Li, Y. et al., 'All-optical multimodal mapping of single-cell-type-specific metabolic activities via REDCAT', Nature Methods (2026), and the briefing is a summary of it.
- [8]
REDCAT is compatible with both fresh-frozen and formalin-fixed paraffin-embedded (FFPE) clinical specimens.
- [9]
A roughly 10-micrometre FFPE or fresh-frozen section on glass is first imaged by the TPEF-SRS-SHG platform to capture label-free metabolic features at single-cell resolution.
- [10]
TPEF measures autofluorescence from reduced NAD(P)H and oxidized flavins (FAD/FMN) to compute an optical redox ratio (NADH/FAD), a proxy for cellular redox balance.
- [11]
Higher optical redox ratio values indicate a more reduced state, consistent with increased glycolysis and/or impaired oxidative phosphorylation.
- [12]
SRS acquires protein and lipid signals by tuning the pump wavelength to 2,930 cm-1, 2,850 cm-1, 3,015 cm-1 and 2,880 cm-1, enabling quantification of lipid/protein and unsaturated/saturated lipid ratios.
- [13]
Spatial omics can infer metabolic programs from transcripts or proteins, but these approaches do not directly report the dynamic metabolic state or robustly link metabolic activity to specific cell types and states.
- [14]
Most mass spectrometry imaging approaches are destructive and often trade molecular coverage for spatial resolution, limiting longitudinal studies and multimodal measurements on the same section.
- [15]
MSI methods such as MALDI, DESI and SIMS can map spatial molecular distributions and, when combined with multiplex protein markers, profile metabolic heterogeneity with high sensitivity.
- [16]
Stimulated Raman scattering provides background-free, concentration-proportional contrast for quantitative imaging, enhancing the inherently weak spontaneous Raman signal.
- [17]
The briefing cites DBiTplus (Enninful et al., Nature Methods, 2026), a paper aimed at integrating imaging-based and sequencing-based spatial omics assays on the same tissue section in clinical pathology.
- [18]
Hyperspectral SRS yields Raman-like spectra for molecular discrimination and metabolic fingerprinting, enabling integration with complementary modalities.
- [19]
The label-free arm of REDCAT produces seven contrast channels before any antibody staining: two autofluorescence channels (NAD(P)H and flavins), four SRS wavenumbers, and one SHG channel.
- [20]
The four SRS pump settings span 165 cm-1, from 2,850 cm-1 to 3,015 cm-1.
Get this ledger inside ChatGPT. Ask about any of our stories and the answer brings its figure, each claim’s verdict and the sources. Free, no account.
Sources
1 independent publisher whose own reporting we read for this story.
- nature.comAll-optical multimodal mapping of single-cell-type-specific metabolic activities via REDCAT
2 articles · August 26, 2026
Topics and entities
Follow any of these and your For You feed starts watching them — no settings page required.