Science3 distinct publishers3 min readPublished
Six whales carrying temperature and salinity tags returned profiles from basins where research ships turn back, roughly matching everything previously archived for Scoresby Sound and giving melt models a measured input where they had estimates.
The Scientist · Science desk

Compiled by The ScientistSomething wrong?How this is made
About 343 profiles per animal [29] is the figure that tells you what kind of dataset this is. The tags did not send back every dive; they kept the deepest qualifying one in each 12-hour window, a ceiling of two a day [6]. The longest-lived tag therefore caps out near 664 profiles [30]. The record is thin in time against what the whales actually did, and thick in precisely the places a hull cannot get to.
Measured against what already existed, the return is substantial. The team folded in more than 2,200 earlier sets of temperature and salinity measurements for the region [10], drawn from the World Ocean Database [11]; the animal-borne profiles come to roughly 94 percent of that total [32]. Scoresby Sound covers about 10,000 square kilometres with water deeper than 1,000 metres [20], and lead author Mads Peter Heide-Jorgensen told Eos there were very few oceanographic measurements from it despite its being the world's largest fjord system [21]. Nearly doubling a region's hydrographic archive in three years is the result here.
The fitted regional trend is about 0.047 C per year from 1960 to 2021 [13]. Carried across 61 years that comes to roughly 2.9 C [31], which is a great deal of warming for seawater, and the reporting does not specify which depth band it belongs to or how the uneven historical coverage was weighted. This figure summarizes the model's read on a sparse archive. It is not a thermometer reading taken at an ice front.
The mechanism the profiles support is bathymetric. These fjords are layered, cold and relatively fresh Polar Water on top, warmer and saltier Atlantic-origin water beneath [14], and most of the Atlantic inflow sits below 150 metres [15]. Glaciers ending in deep basins were significantly warmer at 200 to 500 metres than glaciers ending in shallow ones [16], and Scoresby Sound and Kangerlussuaq ran warmer and saltier than the shallower Blosseville Coast [17]. Sill depth decides which glacier front gets heat; distance from open water matters less, which is why the authors name Nordvestfjord, Nansen Fjord and Kangerlussuaq Fjord as likely affected while shallow coastal glaciers are less so [34]. Heide-Jorgensen was careful with Eos on the novelty: atlantification in East Greenland was already established from other work, and what surprised the team was how far inland it goes [9].
The study also links bigger summer iceberg discharge to higher temperature and salinity below about 200 metres, and the authors state that the relationship does not show how much ice the Atlantic water melted [18]. Both quantities move with season, so the pairing documents exposure rather than a melt rate. How representative any single water column is remains unclear, because narwhals prefer cold water and probably sampled the Atlantic layer less often than the Polar Water above it, and they swam their own routes rather than survey lines [19]. Ship casts were collected alongside [28], which is the only way to check that bias.
Ranked by verification strength, evidence, and original report placement.
The readings showed that warmer, saltier water of Atlantic origin had travelled as far as 300 kilometres (186 miles) inland, through channels into basins hundreds of miles from the open coast, and that research vessels often must turn back where narwhals can continue swimming.
Heide-Jorgensen said scientists already knew from other studies that atlantification is occurring in East Greenland, but it was surprising to see how much Atlantic water is flowing into areas 300 kilometres or farther from Greenland's outer coast.
The researchers combined the narwhal records with more than 2,200 earlier sets of temperature and salinity measurements and modelled how conditions changed with depth, location and season.
The historical oceanographic data came from the World Ocean Database for the Scoresby Sound region.
The study linked greater summer iceberg discharge with higher temperatures and salinity below about 200 metres (660 feet), but that relationship does not show exactly how much ice the Atlantic water melted; it shows that some remote glaciers are exposed to more ocean heat.
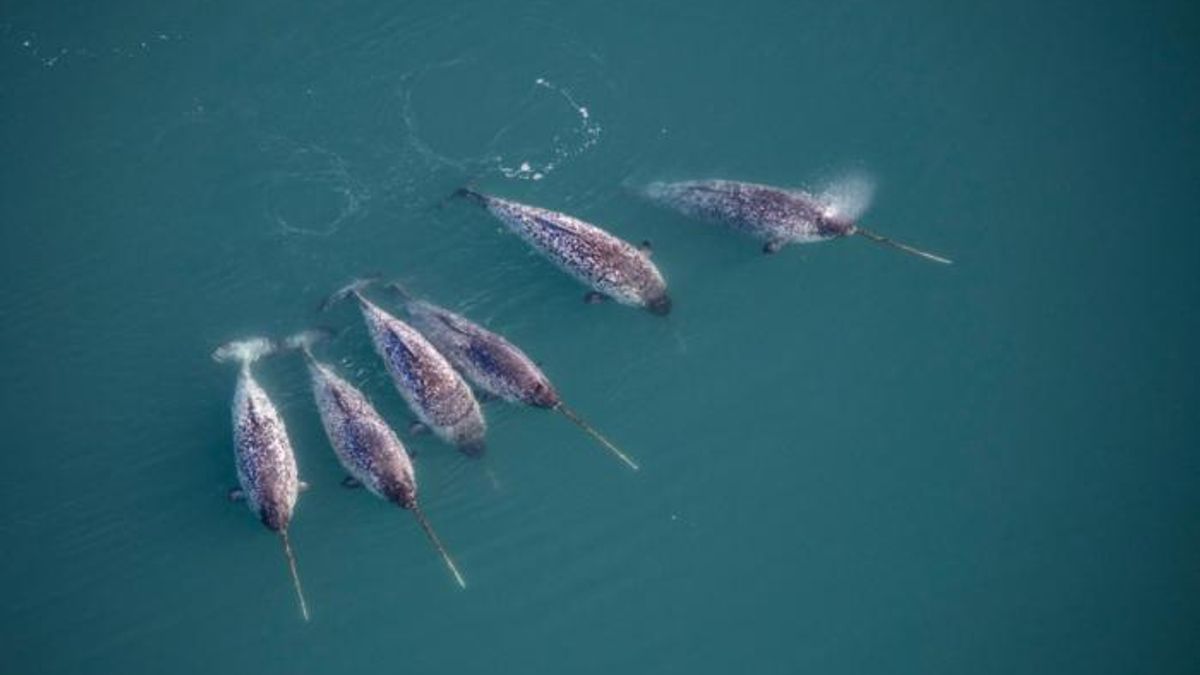
Near Scoresby Sound in East Greenland, local hunters helped a research team briefly capture six narwhals and fit them with ocean sensors, which the whales carried on their regular dives through the fjord system.
Distinct publishers with included, body-backed reporting in this cluster.
discovermagazine.com
1 article · August 28, 2026
eos.org
1 article · August 26, 2026
phys.org
1 article · August 26, 2026
Follow any of these and your For You feed starts watching them — no settings page required.
science
Whales at 70 north: East Greenland's food web is being rebuilt in one career's span2 distinct publishers
science
Narwhal tusks hide two spirals twisting against each other, and the mismatch is the point3 distinct publishers
science
Sleep tech turns rest into evidence, and employers are the ones who will need rules1 distinct publisher
product
Penn State imaged 100 meters of subsurface using lightning and buried telecom fiber2 distinct publishers
Evidence-backed comparisons of source perspectives and observed adoption signals. Read the methodology
Which Builder, Operator, and Investor concerns the observed source mix emphasized—not a truth score.
Evidence, demonstrated adoption, hype gap, incentives, and confidence are assessed independently, each on its own current evidence. How these are measured.
One peer-reviewed paper, three faithful readings
Everything factual here traces to a single Science Advances paper with a printed DOI, and the three accounts agree wherever they overlap — 2,060 dives, 300 kilometres inland, the thickening Atlantic layer. That consistency is transcription, not replication. What lifts the evidence is internal: a named archive to compare against, depth-resolved contrasts rather than a single headline number, and a limitation the authors themselves concede about uneven sampling. What caps it is that no outlet checked the findings with an outside oceanographer; Eos's two independent voices vouch for the method, not the result.
The instrument is proven; the payoff is still pending
This is a real three-year deployment, not a demonstration: tags stayed on for up to 332 days and returned enough profiles to nearly match the whole prior archive for Scoresby Sound, and the data has already been fused with World Ocean Database records into a working model. Laidre's note to Eos that narwhals have carried instruments several times before means the platform is established practice, with salinity the genuinely new capability. What has not happened yet is the part the release emphasises: no climate model has been shown taking these profiles as input.
Numbers hold up; the framing runs ahead of them
The measurements are stated conservatively and the rhetoric is not. The paper's own line about 'unconventional collaborators' revolutionising oceanographic research, quoted by Eos, sits above a dataset of two profiles a day from six cold-water-preferring animals. Phys.org's headline pairing of warm water with accelerating melt outpaces what was actually established: Discover Magazine is explicit that the iceberg-discharge correlation shows glaciers exposed to more heat, not how much ice melted. The gap is modest and mostly one of emphasis — the 300-kilometre reach and the layer thickening are solid findings that do not need the amplification.
Release-shaped, unevenly counterweighted
Two of the three accounts run on material the researchers supplied. Phys.org reproduces the University of Copenhagen framing with only Heide-Jørgensen and Ditlevsen speaking, and Discover Magazine draws its quotes from the same press release even as it adds independent methodological detail and the caveats. Only Eos brings in voices with nothing riding on the paper, and even those endorse animal-borne sampling in general. The interest at work is ordinary institutional promotion of a hard-won dataset — visible, not concealed, and disclosed down to the citation and the animal-care approval.
Firm on how, thinner on how much
We can be confident about the apparatus and the dataset's shape: capture, retention, duty cycle and totals are reported consistently and in enough detail to check the arithmetic. Confidence thins on the quantitative climate claims. The 0.047 C per year trend since 1960 — the number with the longest reach — appears in only one of the three accounts, and the melt attribution is explicitly qualified. Add the acknowledged uneven coverage across fjords and water layers and the honest position is high confidence in the method, moderate confidence in the magnitudes.