BuildNot yet confirmed elsewhere1 publisher3 min readPublished
Two regions, 86ms apart, 28 TPS: the WAN was not the bottleneck, Python was
A 7B model split across Iowa and Oregon on free T4s went from 4.92 to 28.10 tokens per second. Most of the gain came from a drafter that stopped launching kernels one at a time.
The Engineer · Build desk
What happened
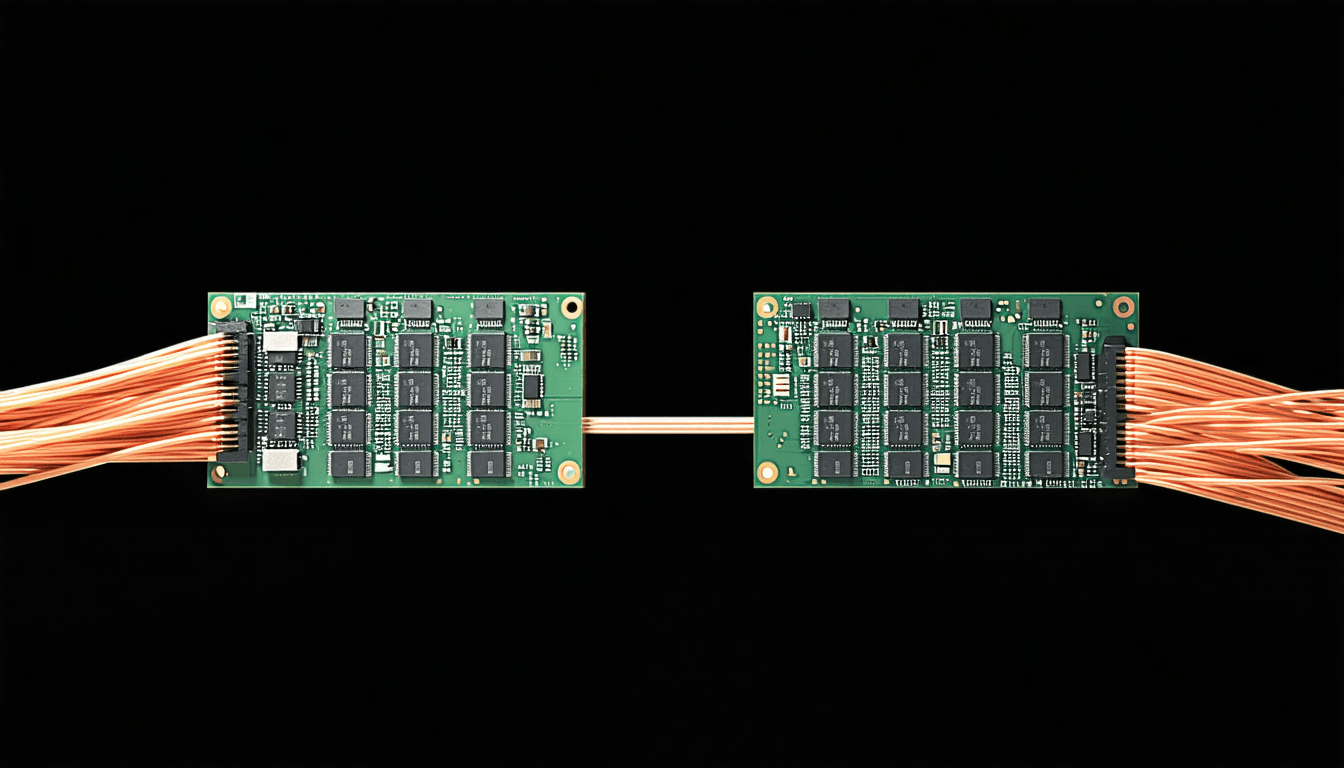
- Qwen2.5-7B was split layer-wise across two Kaggle T4s, Iowa and Oregon, talking through a TCP relay on an EC2 t3.micro in Ohio.
- With no optimisation, that topology produced 4.92 tokens per second.
- Speculative decoding with a 0.5B drafter proposing 8 candidates committed an average of 4.07 tokens per round trip instead of one.
- Draft generation still cost 112ms per round, with the GPU idle 65% of the time while Python issued kernel launches.
- Capturing the drafter's forward pass as a CUDA Graph took peak throughput to 28.10 TPS.
Why it matters
- capability Once a round trip carries four accepted tokens, its cost falls to about 21ms per token, which is what makes splitting a model across regions on commodity internet worth attempting at all.
- constraint Further drafter tuning cannot get past roughly 47 TPS on this path; only a better acceptance rate or fewer hops will, so optimisation effort has to move upstream.
- decision Anyone pricing a private interconnect for distributed inference now has to weigh it against auditing their own launch overhead first, because here the Python loop cost more than the wire.
- contradiction The reported gains do not fully reconcile: the draft fix accounts for 87ms of a 140ms round-time improvement, so either the peak figures come from different windows or something else changed...
Run the arithmetic on the round rather than the token and the numbers get more interesting than the headline. At 28.10 TPS with 4.07 tokens committed per accepted round trip [1][8], a round lasts about 145ms [24]. Eighty-six of those milliseconds are wire [6] and 25 are the draft model [14], which leaves roughly 34ms for the 7B verification slice on Node 1 and every other cost in the loop [24]. Do the same sum for the eager-mode configuration the author reports at 14.3 TPS [9] and the round is 285ms, of which 86ms is wire and 112ms is drafting [12], leaving 87ms of residual [21].
Those two residuals do not match. The graph capture removed 87ms of drafting per round, but round time fell by 140ms [25]. Fifty-three milliseconds came off something the writeup does not itemise [25]. Part of that is probably the mixing of peak throughput figures with an average acceptance rate, which is the weakest joint in the measurement, and it is the first thing worth pinning down before anyone treats 28.10 as reproducible.
The mechanism behind the drafter fix does check out, though, and it checks out almost exactly. Eight candidate tokens meant eight forward passes of roughly 1,500 kernels each [10], so about 12,000 launches per round; at the 8 to 10 microseconds Python needs to issue each one [11], that is 96 to 120ms of pure launch overhead [23]. The reported 112ms draft phase [12] sits inside that bracket, which means the draft phase was essentially all bookkeeping and none of it compute. A 65% GPU idle rate [12] is the same fact seen from the other side.
Which reframes what the network was ever costing. At the 4.92 TPS baseline [5], a token takes 203ms and the 86ms round trip is 42% of it [20]. Amortised over 4.07 accepted tokens, the same round trip costs 21ms per token [19]. After that, the Python launch overhead in the drafter was larger than the entire Iowa-to-Oregon-to-Ohio path [23][6]. The interesting engineering conclusion is not that the WAN turned out to be survivable; it is that a 2,000km hop and a t3.micro relay [4] were quietly cheaper than a for-loop in the same process.
The ceiling that remains is arithmetic, not effort. At 86ms per round trip and 4.07 tokens accepted, the network alone caps this topology at 47.3 TPS [22], and 28.10 is 59% of that [22]. Nothing done to the drafter moves that number. Raising it means a higher acceptance rate, a larger draft window, or fewer hops between the two shards.
The cost of the trick is a memory contract that transformers does not honour by default. CUDA graphs capture fixed addresses, and HuggingFace's DynamicCache calls torch.cat at every token step, allocating a fresh buffer that the graph never learned about [15][16]. The failure signature the author describes is repeated output, not a crash [15], which is the expensive kind: it looks like a sampling problem. Holding it together took StaticCache, in-place tensor mutation, manual position_ids updates, and an in-place KV rewind for rejected drafts [17]. That is four places where a library upgrade can silently reintroduce a stale pointer.
What to watch
- An acceptance-rate distribution rather than a 4.07 mean: if the tail is long, both the per-round arithmetic and the 47.3 TPS ceiling move.
- The same rig with both shards in one region, which would isolate how much of the 145ms round is really the WAN.
- Whether the StaticCache and position_ids plumbing survives a transformers version bump, or whether the graph starts reading stale addresses again.
Clarity's read
What the record supports and how the coverage leans. The claims behind it follow.
Reality
- Evidence42
- Adoption16
- Hype gap+22
- Incentives58
- Confidence38
Claim ledger
Ranked by verification strength, evidence, and original report placement.
- [1]
ShardFlow v2.1 reaches 28.10 TPS peak on Qwen2.5-7B across two separate cloud regions over WAN.
- [2]
The project runs on free Kaggle T4 notebooks, an AWS EC2 t3.micro relay, and the public internet, with no A100s and no private datacenter network.
- [3]
A 7B parameter model in FP16 needs roughly 15 GB of VRAM; a single Kaggle T4 has 16 GB, leaving nothing for a KV cache.
- [4]
Node 0 in Iowa handles layers 0 to 14, Node 1 in Oregon handles layers 14 to 28 plus the LM head and final verification, and they communicate through a TCP relay on an EC2 t3.micro in Ohio.
- [5]
Baseline throughput for the two-node tensor-parallel setup with no optimisations was 4.92 TPS.
- [7]
Qwen2.5-0.5B is used as the draft model on cuda:1 of Node 0 while the 7B target slice runs on cuda:0, giving zero VRAM contention.
- [8]
The drafter proposes 8 candidate tokens, Node 1 verifies them in parallel, and the average is 4.07 tokens committed per round trip instead of 1.
- [9]
With speculative decoding in eager mode, peak throughput was 14.3 TPS.
- [10]
Generating 8 candidate tokens meant 8 separate forward passes through the 0.5B model, each launching roughly 1,500 CUDA kernels one at a time from a Python loop.
- [11]
Each CUDA kernel executes in 2 to 5 microseconds on the GPU, but Python needs 8 to 10 microseconds just to issue the launch call.
- [12]
Draft generation cost 112ms per round and the GPU idle rate was 65%.
- [13]
A CUDA Graph captures a sequence of GPU operations once so that replaying the whole forward pass costs one driver call, with no Python in the hot path.
- [14]
Capturing the 0.5B draft model's forward pass as a CUDA Graph cut draft generation from 112ms to 25ms, 4.5x faster.
- [15]
Early CUDA Graph attempts made the model loop, repeating the same token, because graphs capture exact GPU memory addresses at record time and a reallocated tensor makes replay read a stale address.
- [16]
HuggingFace's default DynamicCache calls torch.cat at every token step, allocating a new buffer and invalidating the address the graph captured.
- [17]
Four changes fixed the graph replay: StaticCache with pre-allocated fixed-size KV buffers, in-place tensor mutation, explicit position_ids updates before each replay, and in-place KV rewind when the verifier rejects draft tokens.
- [18]
Going from 4.92 TPS to 28.10 TPS is a 5.71x improvement in throughput.
- [19]
Amortised over 4.07 accepted tokens, the 86ms round trip costs about 21ms of network time per token instead of 86ms.
- [20]
At the 4.92 TPS baseline a token takes 203ms, so the 86ms round trip is about 42% of per-token latency.
- [21]
At 14.3 TPS a 4.07-token round lasts about 285ms; subtracting 86ms of RTT and 112ms of drafting leaves about 87ms of residual.
- [22]
With 86ms per round trip and 4.07 tokens accepted per round, the network alone caps this topology at about 47.3 TPS, and 28.10 TPS is 59% of that ceiling.
- [23]
Eight forward passes of about 1,500 kernels is roughly 12,000 launches per round, which at 8 to 10 microseconds of Python launch cost each is 96 to 120ms, bracketing the reported 112ms draft phase.
- [24]
At 28.10 TPS a token takes 35.6ms, so a 4.07-token round lasts about 145ms; subtracting 86ms of RTT and 25ms of drafting leaves roughly 34ms for verification and all other per-round cost.
- [25]
The CUDA Graph fix removes 87ms of draft time per round, but implied round time falls from 285ms to 145ms, a 140ms improvement, leaving about 53ms unexplained by the draft fix alone.
Sources
1 independent publisher whose own reporting we read for this story.
- dev.toI Got 28 TPS Out of Free Kaggle GPUs. Here's What It Took.
1 article · August 23, 2026
Topics and entities
Follow any of these and your For You feed starts watching them — no settings page required.