Build1 publisher3 min readPublished Updated
Two vendor counters, no benchmark: 1,816 parcels an hour is not a procurement number
X Square Robot reports 1,816 parcels in an uncut hour at above 98% success, roughly 45% over Figure AI's 200-hour average. Neither run shipped an intervention log, so neither is comparable.
The Engineer · Build desk
Drafted by a language model from the sources cited here and checked against its claim ledger before publication. How we use AISend a correction
What happened
- X Square Robot published a 65-minute official recap of an August 12 logistics demonstration in which a stationary dual-arm system handled parcels continuously on a sorting line.
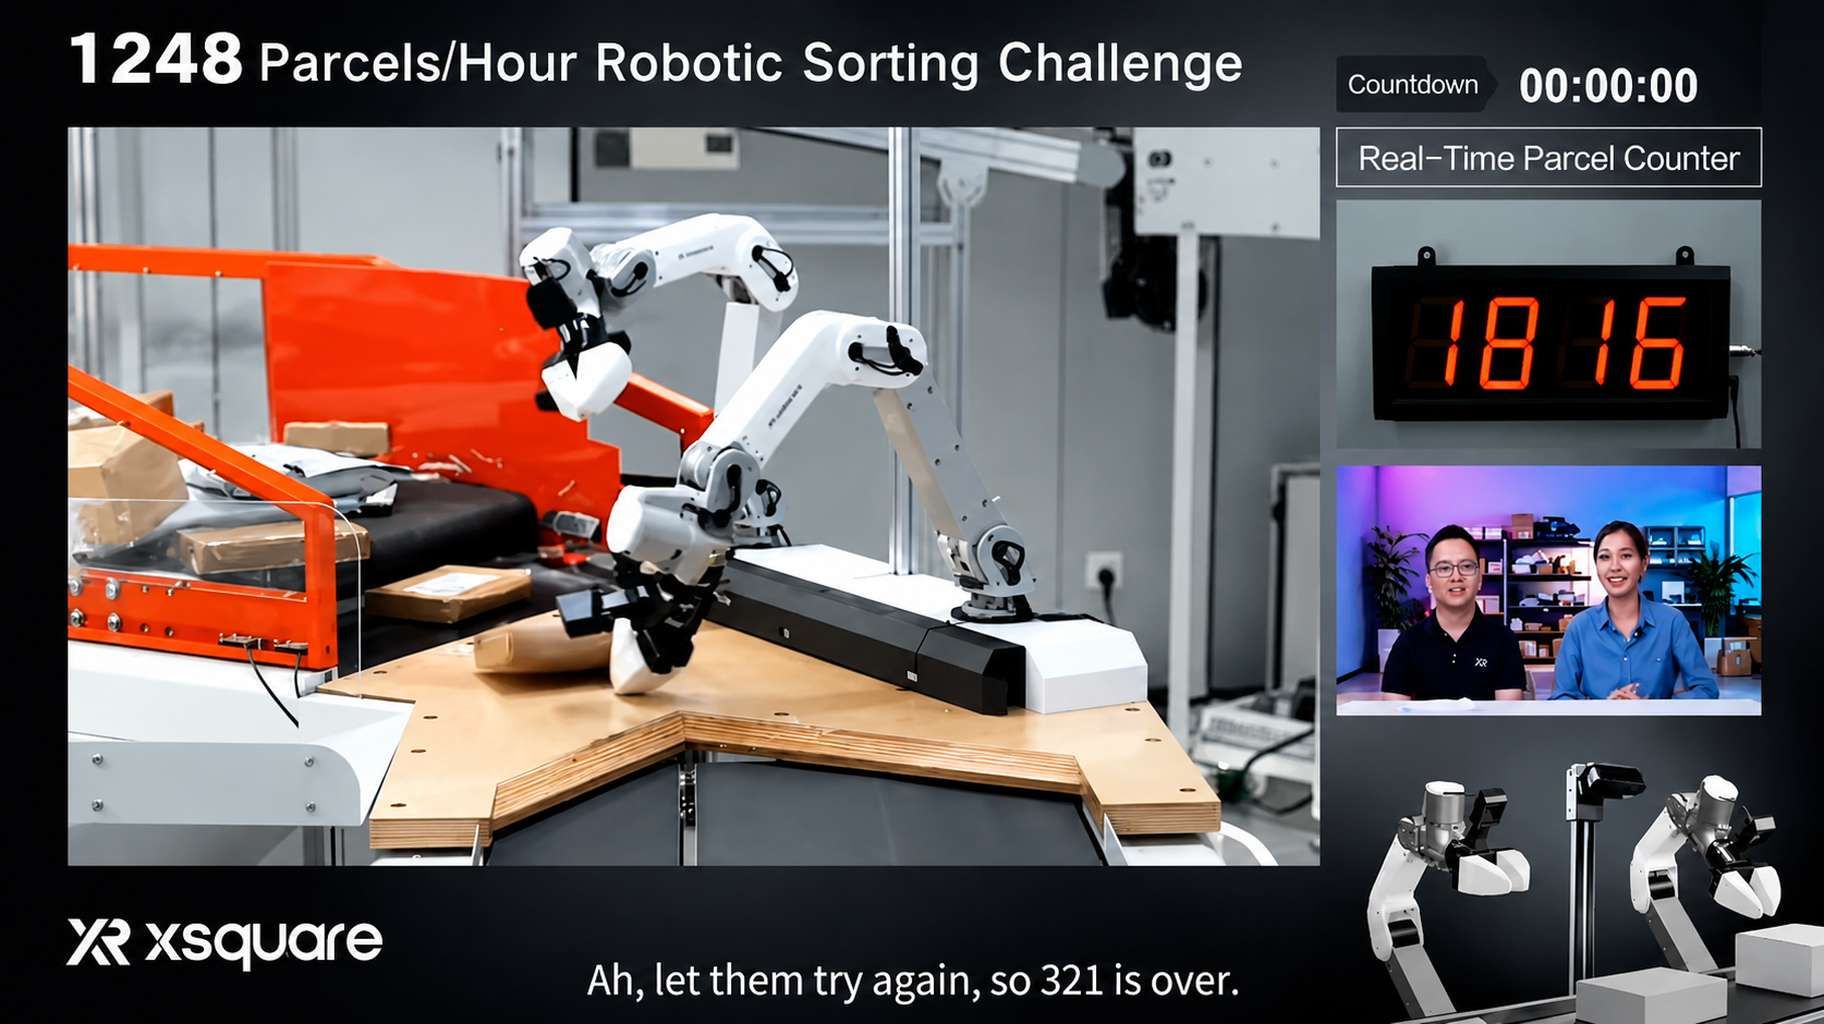
- X Square Robot reports 1,816 parcels sorted in one hour with a success rate above 98%, labelling the run a live challenge.
- Pandaily separately reported the same counter total and described the stream as unedited.
- The performance figures remain company-reported: no independent technical audit, intervention log or standardized benchmark result accompanied the public demonstration.
- In Figure AI's May endurance demonstration, the robot team processed 249,560 packages across 200 hours.
Compiled by The EngineerSomething wrong?How this is made
Why it matters
X Square Robot has published a 65-minute official recap of an August 12 logistics demonstration in which a stationary dual-arm system handled parcels continuously on a sorting line, and reports 1,816 parcels in one hour at a success rate above 98% [1][2]. Pandaily separately reported the same counter total and described the stream as unedited [3], but no independent technical audit, intervention log or standardized benchmark result accompanied the demonstration [4], which leaves buyers with a number they cannot procure against.
The comparison on offer is with Figure AI's May endurance demonstration, where the robot team processed 249,560 packages across 200 hours [5], an average of 1,247.8 per hour [6]. X Square's figure is roughly 45% higher [7], about 568 more parcels an hour [8]. Expressed as cycle time, that is one parcel every 1.98 seconds against one every 2.88 seconds [9][10]. Worth noting who framed the contest: the target displayed during X Square's run was 1,248 parcels, which closely matches Figure's average [11]. The reference point was set by the vendor, not by an evaluator.
The systems are not the same machine doing the same job. X Square used a stationary dual-arm cell with simple grippers; Figure's demonstration involved humanoid robots in a different operating setup [12]. The public records do not establish identical parcel mixes, task definitions, error-counting rules, intervention policies, power constraints or total system cost [13]. The durations are also not equivalent: one hour is 0.5% of a 200-hour run [14].
Take the success rate at face value and above 98% on 1,816 parcels implies fewer than about 36 failed parcels in the hour [15]. Whether those failures were recovered by the machine or cleared by a person is not in the public record, because no intervention log was published [4]. That single omission is what separates a countable demo from an operating claim. An uninterrupted hour does beat a highlight reel, because repeated cycles, recovery behavior and variation over time are visible [16]. It answers one question out of six that matter.
What a logistics team would actually need is reproducible trials on its own parcel mix, documented failure and intervention rates, sustained uptime across full shifts, safety controls, integration requirements, and cost per successfully handled parcel [17]. None of that is in either release. The useful signal here is structural rather than competitive: embodied-AI vendors are shifting from isolated clips to longer, countable demonstrations [18], and the next step is common evaluation conditions plus independently reviewed operating data so counters can be converted into production economics [19].
Watch for the first vendor in this category to publish an intervention log alongside a throughput number, and for whether either company runs on a customer's parcel mix rather than a staged line. Watch also for who defines the error-counting rules [13]: until a third party owns the task definition and the failure taxonomy, every new record is a run against a rule set the runner wrote. On the current evidence, a warehouse operator comparing these two systems has two press releases and no procurement input.