InvestNot yet confirmed elsewhere1 publisher2 min readPublished
U.S. and Europe now take 52% of Korea's food, beauty and bio exports, up from 19% in 2016
Korean exports of seven food, beauty and bio products reached $15.59 billion in January-August, 4.2 times 2016 against 2.2 times for all exports. On the chamber's figures the U.S. and Europe now take 52% of it, up from 19%.
The Investor · Invest desk
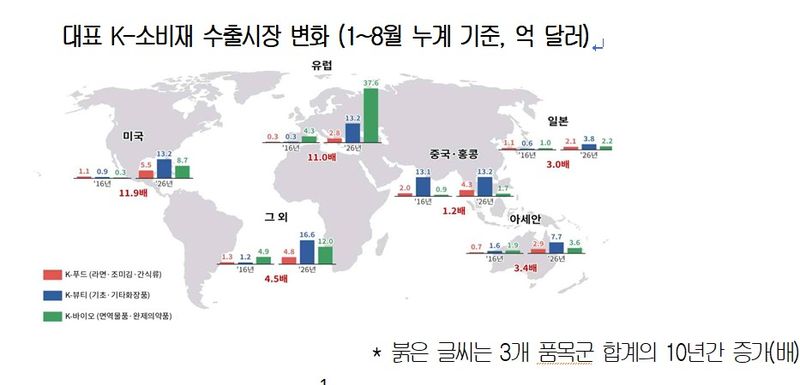
Bar chart of export growth multiples since 2016 for seven Korean food, beauty and bio products: United States 11.9 times, Europe 11 times, China and Hong Kong 1.2 times, and all destinations together 4.2 times.
Growth multiple, Jan-Aug this year vs same period of 2016 In times
| Item | Value | Claim |
|---|---|---|
| United States | 11.9 times | 2 |
| Europe | 11 times | 2 |
| All destinations | 4.2 times | 1 |
| China and Hong Kong | 1.2 times | 2 |
What happened
- U.S. exports of the seven products grew 11.9 times to $2.74 billion and European exports 11-fold to $5.36 billion, while China and Hong Kong grew only 1.2 times.
- The U.S. overtook China as the largest destination for the food category (ramyeon, gim and snacks) in 2020.
- Europe's share of bio exports rose from 32.3% in 2016 to 57.1% this year, driven by growing biosimilar supplies.
- Small and midsize companies made 93.1% of food exports and 91.3% of beauty exports in January-August.
Why it matters
- contradiction Spread varies by product: the U.S. buys 40.4% of seasoned laver exports against 28.1% of snacks and 17.6% of ramyeon, so laver exporters carry the most single-buyer risk in food.
- exposure A downturn in European biosimilar demand would land mainly on large companies, which supply 72.8% of bio exports.
- constraint The chamber says growth now needs strategies fitted to each country's certification rules, distribution networks and trade environment, so every added market is its own project for a small exporter.
- decision Help with first sales channels, logistics and the step up to midsize is a funding choice for someone, and the chamber's call does not say who would provide it.
Two destinations explain most of the gain. The U.S. and Europe bought $8.10 billion of the $15.59 billion shipped in January-August [15][1], against $0.72 billion of the $3.74 billion in the same months of 2016 [16][1], so their share went from 19% to 52% [18][17]. They also supplied $7.38 billion of the $11.85 billion increase, or 62% [20][19][21]. Every other destination together, China and Hong Kong included, supplied the remaining $4.47 billion [22]. China and Hong Kong grew 1.2 times, against 2.2 times for all Korean exports [2][1].
We think the diversification reading holds for the total and for beauty. In 2016 China and Hong Kong alone took 74.2% of beauty exports [3], and since then U.S. shipments of the category have grown 15.3 times and European shipments 43.9 times [4]. Bio is where we would look for it to fail, or rather the category where the evidence points the other way: large companies' share of its exports is up 20.8 points since 2016 [8], from 52.0% [23], and the growth leans on Europe [6]. The counter-thesis is that two large buyers are a different risk from one. Europe alone, at $5.36 billion [2], now buys 1.4 times the $3.74 billion that every destination bought in 2016 [25][1].
We would be wrong on bio if later releases show U.S. sales rising alongside Europe's. We would be right if a fall in European demand pulled bio down while beauty and food held.
Beauty is also where small firms have grown fastest. Their cosmetics exports rose from $1.38 billion to $6.18 billion, 4.5 times [10], and the number of small skin-care exporters went from 2,808 in 2016 to 6,019 last year [11], about 2.1 times [24]. The two series differ in product scope and period, so they cannot be divided into a per-firm figure.
Lee Si-wook, head of economic research at the KCCI, said: "Since each product category grows in a different way, we need tailored strategies that consider regional and corporate characteristics to turn the export base built by thousands of small and midsize companies into a sustained growth engine." [14]
What to watch
- Next year's KCCI release: whether U.S. bio sales grow alongside Europe's, or Europe's 57.1% share of bio exports keeps rising.
- Whether the U.S. share of seasoned laver exports stays near 40.4% as the category grows.
- Whether any government body or industry group funds the chamber's request for small-firm channel and logistics support.
Clarity's read
What the record supports and how the coverage leans. The claims behind it follow.
Reality
- Evidence62
- Adoption
- Insufficient
- Hype gap+8
- Incentives40
- Confidence60
Claim ledger
Ranked by verification strength, evidence, and original report placement.
- [1]
Outbound shipments of seven representative food, beauty and bio products totaled $15.59 billion from January to August, 4.2 times the $3.74 billion in the same period of 2016, versus a 2.2-times increase in all exports over that time.
ReportedSupportedSource: Korea Chamber of Commerce and Industry (KCCI) 10-year analysis, reported by Korea JoongAng DailyView cited source - [2]
Exports to the United States grew 11.9 times, from $230 million to $2.74 billion, while exports to Europe rose 11-fold from $490 million to $5.36 billion. Exports to China and Hong Kong grew only 1.2 times.
- [3]
In beauty, China and Hong Kong took 74.2 percent of the category's exports in 2016; this year China and Hong Kong, the United States and Europe each account for about 20 percent.
- [4]
In beauty, exports to the United States grew 15.3 times and exports to Europe grew 43.9 times.
- [5]
Combining ramyeon, gim and snacks, the United States overtook China as the largest export destination for the food category in 2020.
- [6]
Europe's share of bio exports rose from 32.3 percent in 2016 to 57.1 percent this year, driven by growing supplies of biosimilars.
- [7]
Small and midsize companies accounted for 93.1 percent of food exports and 91.3 percent of beauty exports from January to August.
- [8]
In bio, large companies took 72.8 percent of exports, up 20.8 percentage points from 2016.
- [9]
This year the United States accounts for 40.4 percent of seasoned laver exports, 28.1 percent of snack exports and 17.6 percent of ramyeon exports.
- [10]
Small companies' cosmetics exports rose four-and-a-half-fold, from $1.38 billion in the first eight months of 2016 to $6.18 billion in the same period this year.
- [11]
The number of small companies exporting skin care products more than doubled, from 2,808 in 2016 to 6,019 last year.
- [12]
The KCCI said that sustaining the growth will require strategies tailored to each country's certification rules, distribution networks and trade environment.
- [13]
The KCCI called for support to help small companies open initial sales channels and handle logistics, as well as a stronger support system to help them grow into midsize firms.
- [14]
"Since each product category grows in a different way, we need tailored strategies that consider regional and corporate characteristics to turn the export base built by thousands of small and midsize companies into a sustained growth engine," said Lee Si-wook, the head of economic research at the KCCI.
- [15]
U.S. plus Europe exports in January-August this year were $8.10 billion.
- [16]
U.S. plus Europe exports in January-August 2016 were $0.72 billion.
- [17]
The U.S. and Europe took about 52% of the seven products' exports this year.
- [18]
The U.S. and Europe took about 19% of the seven products' exports in 2016.
- [19]
Total exports of the seven products rose $11.85 billion between 2016 and this year.
- [20]
U.S. plus Europe exports rose $7.38 billion between 2016 and this year.
- [21]
The U.S. and Europe supplied about 62% of the increase in exports.
- [22]
All other destinations together supplied $4.47 billion of the increase.
- [23]
Large companies' share of bio exports in 2016 was 52.0%.
- [24]
The number of small skin-care exporters grew about 2.1 times.
- [25]
Europe's exports this year ($5.36 billion) are about 1.4 times the 2016 total across all destinations ($3.74 billion).
Sources
1 independent publisher whose own reporting we read for this story.
Topics and entities
Follow any of these and your For You feed starts watching them — no settings page required.