Invest1 publisher2 min readPublished
Spot Ether ETFs shed $206 million in five sessions as the price holds near $2,700
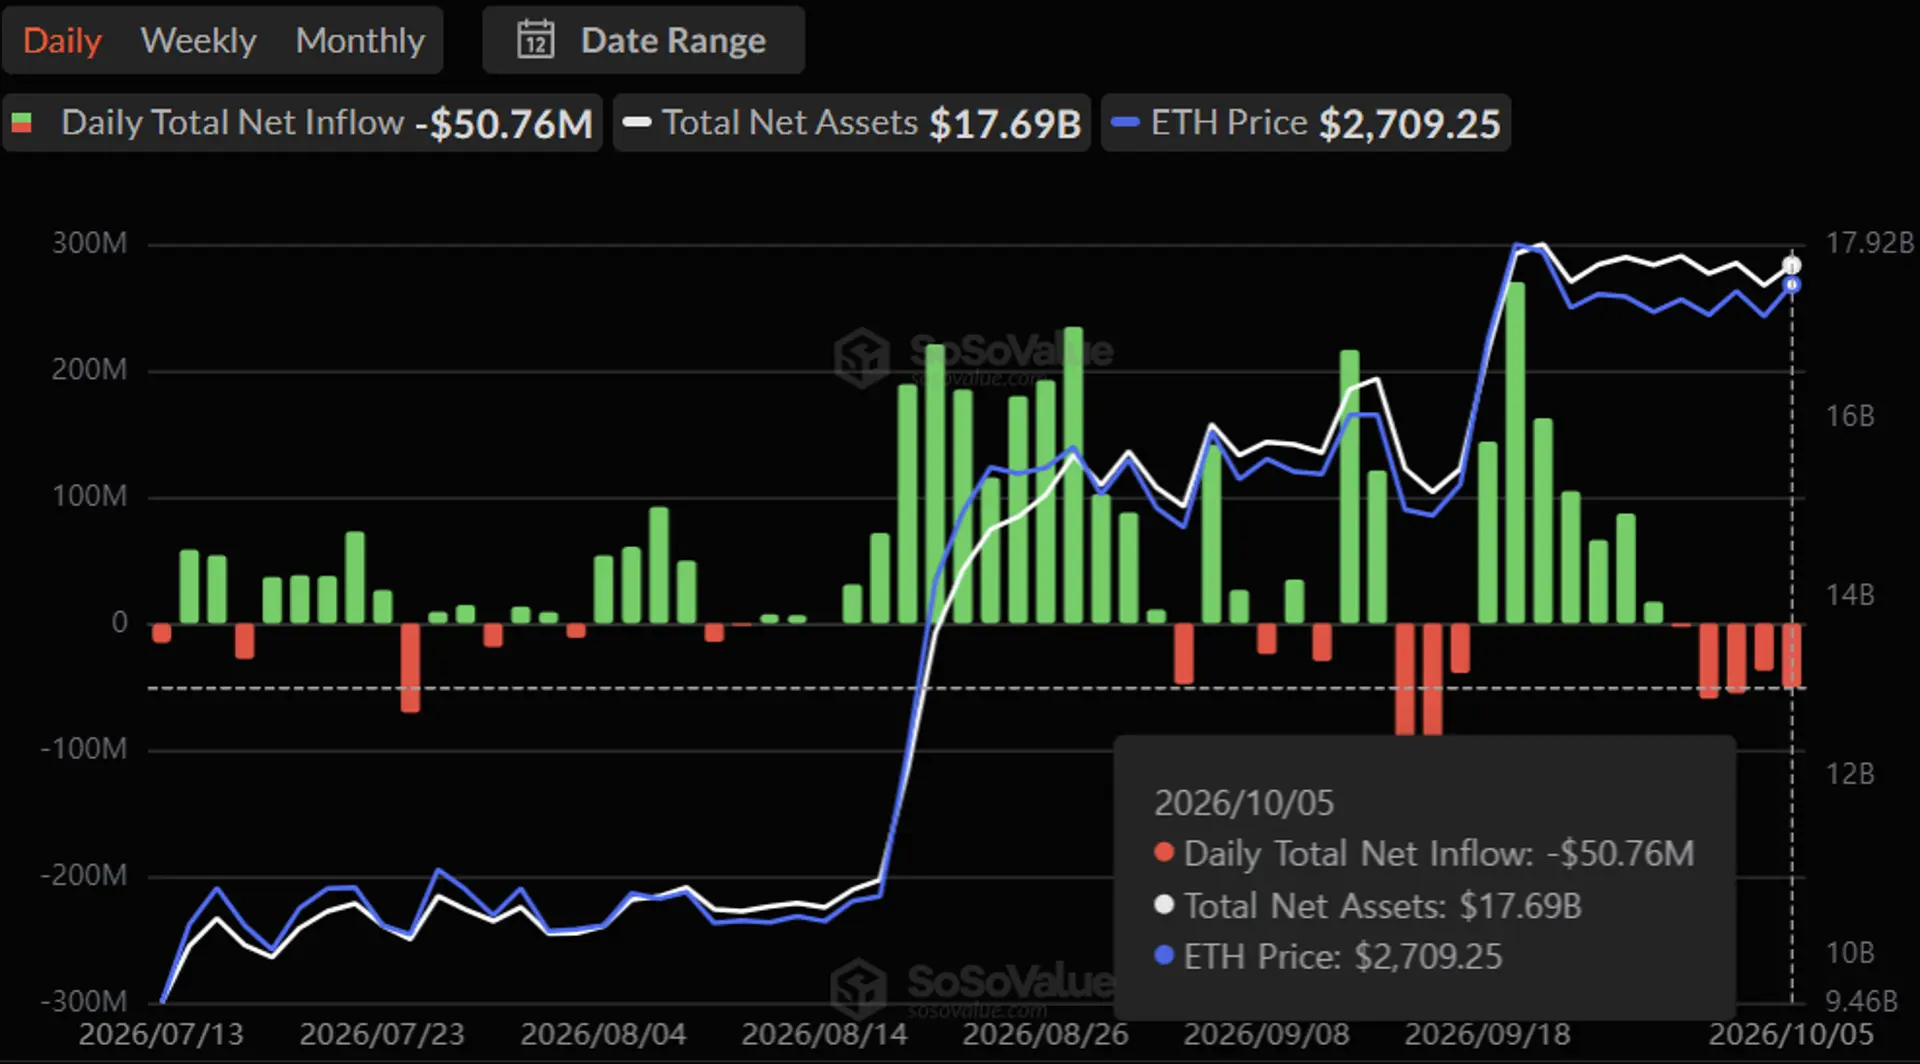
US spot Ether ETFs recorded net outflows for five straight sessions through October 5, totaling $205.88 million, as ETH held near $2,711. The withdrawals coincide with a leverage ratio at a seven-month low, leaving one of the market's main demand channels in retreat while spot buyers absorb the selling.
The Investor · Invest desk
Drafted by a language model from the sources cited here and checked against its claim ledger before publication. How we use AISend a correction
What happened
- October 5 took another $50.76 million out of the US spot Ether funds, the fifth consecutive down session on SoSoValue's count.
- ETH still traded roughly 44 percent above its August 6 level, so the surge in aggressive selling had not reversed the broader advance.
- Santiment said its Age Consumed metric spiked to 580 million token-days on September 30, about nine times the September weekday average and the highest since June 2.
Compiled by The InvestorSomething wrong?How this is made
Why it matters
- constraint The spot ETF is one of the market's main sources of incremental demand, so five sessions of net selling removes the bid that helped carry ETH off its August lows, leaving the price dependent on other buyers.
- contradiction The signals disagree: ETF outflows and record negative taker volume point to selling, while a seven-month-low leverage ratio and a price up 44 percent from August say that selling is being absorbed.
- capability A persistently negative funding rate with ETH holding its range would force shorts to pay longs, turning short covering into a fresh source of demand.
The outflow is real, but small. The $205.88 million pulled since September 29 is about 1.5 percent of the $13.75 billion in cumulative net inflows these funds have taken in. At an average near $41 million a session, it is enough to unwind a few days of buying. [2][15][16] October 5 alone accounted for $50.76 million, above that average, so the pace was still rising when the streak reached five. [1] The run began the day after a $17.1 million inflow on September 28. [3]
The derivatives data is where the signals point opposite ways at once. CryptoQuant's estimated leverage ratio has fallen to 0.66, a seven-month low, with Binance at 0.68 and OKX at 0.64. [4][5] Open derivatives exposure has shrunk relative to the ETH held on exchanges. CryptoQuant contributor Arab Chain attributes the drop to weaker appetite for heavily leveraged positions around $2,700 and sees it easing liquidation pressure. [6]
Open interest has gone the other way. On Binance it sits near $3.3 billion, up about 43 percent from $2.3 billion on August 6. [7] Taker flow turned: cumulative net taker volume fell from $1.94 billion on August 21 to minus $1.36 billion on October 5, a $3.30 billion reversal and the weakest since August, with sellers crossing the spread to get filled. [8] ETH is still roughly 44 percent above its August 6 level. [9]
Santiment flagged a separate move. Its Age Consumed metric, which weights dormant coins moving onchain by how long they sat still, spiked to 580 million token-days on September 30, about nine times the September weekday average and the highest since June 2. Large spikes sometimes precede selling by long-term holders. [10][11] This time the coins did not reach exchanges. Balances rose about 18,000 ETH on September 30 and fell about 21,000 the next day, a net move of roughly 3,000 ETH against the 5.9 million held on trading venues. When Age Consumed last spiked harder, on June 2, exchange balances rose by more than 140,000 ETH. [12][17][13] The pattern looks more like custody or staking reshuffling than distribution.
The real divergence is between aggressive selling and a price that will not break. This is probably the constructive case, or the conditional one. If buyers keep absorbing taker sell orders and funding turns persistently negative while ETH holds its range, the shorts behind those negative prints start paying longs. Covering becomes demand. [18] The simpler reading is bearish. The ETF bid is one of the market's main sources of incremental demand, and the easiest to measure, and it has run the other way for five sessions. [14][1]
What to watch
- Whether the ETF outflows spread to exchange balances or stay inside the fund wrapper.
- Whether a sixth session extends the streak or inflows return to the US spot funds.
- The next Age Consumed reading, and whether dormant coins start landing on exchanges.