BuildNot yet confirmed elsewhere1 publisher2 min readPublished
Netflix's observability team treats cross-stack incident correlation as a data engineering problem
Netflix's observability team says tying user experience to system performance at 38 million log events a second is a data engineering problem. Its proposed answer, named in the talk's title, is an ontology-driven end-to-end knowledge graph.
The Engineer · Build desk
What happened
- Netflix peaked at 65 million concurrent streams during the Jake Paul versus Mike Tyson boxing match at the end of 2024, one of its first major live events.
- Vijayanathan described the traditional loop as a flag, a manual triage to the right team and developer, a rolled-out fix, then a check that the data returns to normal.
- The team's goal is a system that detects issues across the whole stack within a few minutes, ranks them by member impact and routes each to the right team automatically.
- Renzo Sanchez-Silva, nearly 10 years on Netflix's monitoring and alerting team, is moving into AIOps and has a research background in ontology.
Why it matters
- constraint Automatic impact ranking and team routing both depend on tracing a service fault to the members it hit and the team that owns it, so those links have to exist before the automation can run.
- cost The linking layer has to be sized for telemetry volume. At Netflix that stream runs about three orders of magnitude above the app request count.
- decision Smaller teams adopting AIOps tools have to judge whether their sessions cross enough owners' schemas to need an ontology, or whether a shared request ID already covers the join.
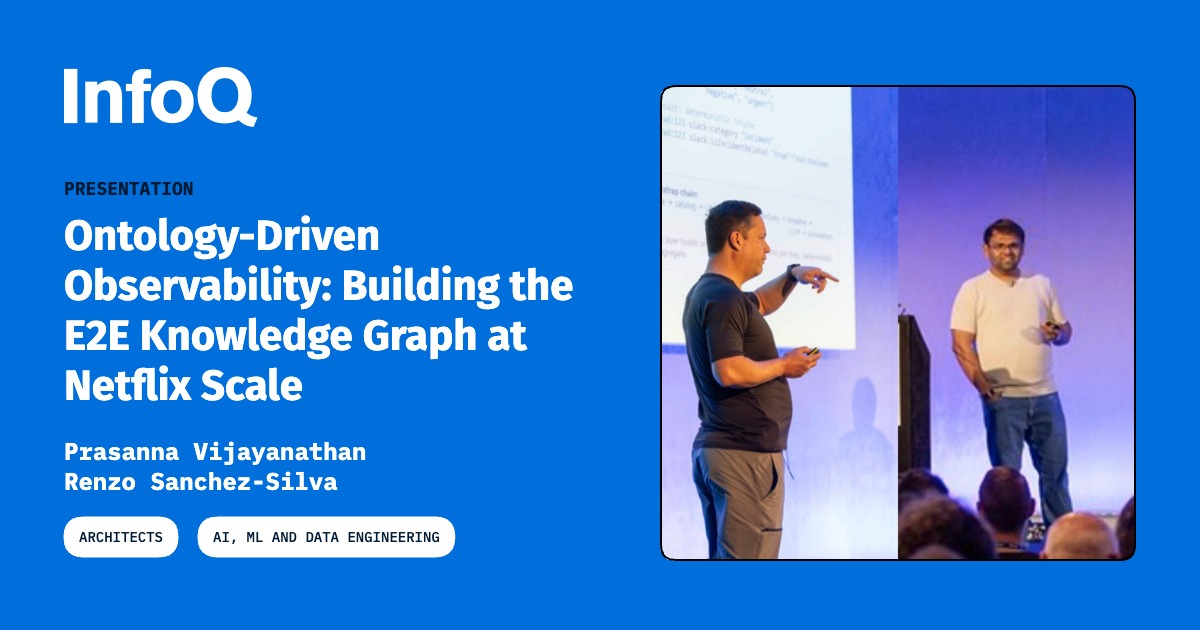
Vijayanathan's remit runs from the moment a member clicks the Netflix logo until playback starts [3]. That path crosses numerous client platforms and devices, thousands of microservices emitting billions of telemetry events, CDN nodes, and thousands of A/B experiments running at once [9]. "It is not a tooling challenge anymore. It is a data engineering challenge," he said [4].
I think the claim holds once you try to write the query. Pinning a playback stall on one device to one service inside one experiment cell means joining the client event, the service log, the CDN node and the experiment assignment. That join needs identifiers that mean the same thing in every system that recorded them. In my view, supplying those shared definitions is the job of the ontology in the talk's title, "Ontology-Driven Observability: Building the E2E Knowledge Graph at Netflix Scale" [13].
The volume figures set the price of building those links. Upward of 38 million real-time logging events a second [8] comes to at least 3.3 trillion a day [15]. Netflix's apps send more than 2 billion requests a day to its servers [7]. Divide one by the other and the telemetry runs at roughly 1,600 logging events per inbound request [16]. Both inputs are floors, and the two are counted separately, so treat the ratio as an order of magnitude. I'd expect most of that multiple to come from fan-out across thousands of services, and a flatter architecture to show a far smaller one.
The target loop removes the manual trace through that data [1]. "You don't have to look at one app and one error and say, I think I'm going to follow this needle through this haystack," Vijayanathan said [2].
"With AI, everything is converging," Sanchez-Silva said [12]. The InfoQ transcript breaks off in the middle of Vijayanathan's sentence, before it describes the ontology's entity types, how the graph keeps pace with the event rate, or what an AIOps layer would query [14].
What to watch
- The rest of the talk, or Netflix engineering write-ups, showing the ontology's entity types and how the graph is updated at 38 million events a second.
- Measured detection times for the 'few minutes' target on real incidents, such as a live event at the 65 million-stream scale.
- Whether Sanchez-Silva's AIOps work queries the knowledge graph directly or runs on raw telemetry beside it.
Clarity's read
What the record supports and how the coverage leans. The claims behind it follow.
Reality
- Evidence35
- Adoption
- Insufficient
- Hype gap+20
- Incentives40
- Confidence30
Claim ledger
Ranked by verification strength, evidence, and original report placement.
- [1]
The team's vision is a system that detects issues automatically in a few minutes across the entire stack, prioritizes them by how they impact users, and triages them to the right team automatically.
ReportedSupportedSource: Prasanna Vijayanathan, InfoQ presentation transcript2 sources— create a free account to open themView cited source - [2]
"You don't have to look at one app and one error and say, I think I'm going to follow this needle through this haystack"
ReportedSupportedSource: Prasanna Vijayanathan, InfoQ presentation transcript2 sources— create a free account to open themView cited source - [3]
Prasanna Vijayanathan works on observability, performance and quality of experience across Netflix's member applications, covering the experience from clicking the Netflix logo until a member starts watching.
- [4]
"It is not a tooling challenge anymore. It is a data engineering challenge."
- [5]
"Today we're going to talk to you about a problem that we've been tackling, which at the surface feels like an observability challenge, but it's really a hard data engineering problem."
- [6]
Netflix's peak traffic during the Jake Paul versus Mike Tyson boxing match, one of its first major live events at the end of 2024, was 65 million concurrent streams.
- [7]
Netflix handles more than 2 billion requests a day from its applications to its servers.
- [8]
Netflix's observability systems handle upward of 38 million real-time logging events per second.
- [9]
Netflix's environment includes numerous client platforms and devices, thousands of microservices emitting billions of telemetry events, CDNs and nodes touched by each member, and thousands of A/B test experiments running across the ecosystem.
- [10]
Traditionally, observability worked as: something goes wrong and you get flagged, you look at what is going on, triage to the right teams, find the right developers to fix it, roll out a fix, then see if the data returns to where it is expected to be.
- [11]
Renzo Sanchez-Silva has been at Netflix almost 10 years on the monitoring and alerting team within observability, building alerting infrastructure, is now getting into the AIOps space, and previously did research in ontology.
- [12]
"With AI, everything is converging."
- [13]
The InfoQ presentation is titled "Ontology-Driven Observability: Building the E2E Knowledge Graph at Netflix Scale".
- [14]
The supplied InfoQ transcript ends mid-sentence in the vision section, before the ontology, the knowledge graph's design or any AIOps layer is described.
- [15]
Upward of 38 million logging events per second is at least about 3.3 trillion logging events per day.
- [16]
Netflix's telemetry runs at roughly 1,600 logging events per inbound app request, about three orders of magnitude; both inputs are lower bounds.
Sources
1 independent publisher whose own reporting we read for this story.
- infoq.comPresentation: Ontology‐Driven Observability: Building the E2E Knowledge Graph at Netflix Scale
1 article · October 9, 2026
Topics and entities
Follow any of these and your For You feed starts watching them — no settings page required.
Topics
- Data engineeringFollow
- AIOpsFollow
- Knowledge GraphsFollow
- ObservabilityFollow