n8n workflow runs now export OpenTelemetry traces, with a span per node if enabled
n8n announced native OpenTelemetry tracing on June 8, 2026, emitting one trace per workflow run and, optionally, a child span for every node. Teams that already run an OTLP-compatible backend can read an n8n run beside their other services.
The Engineer · Build desk
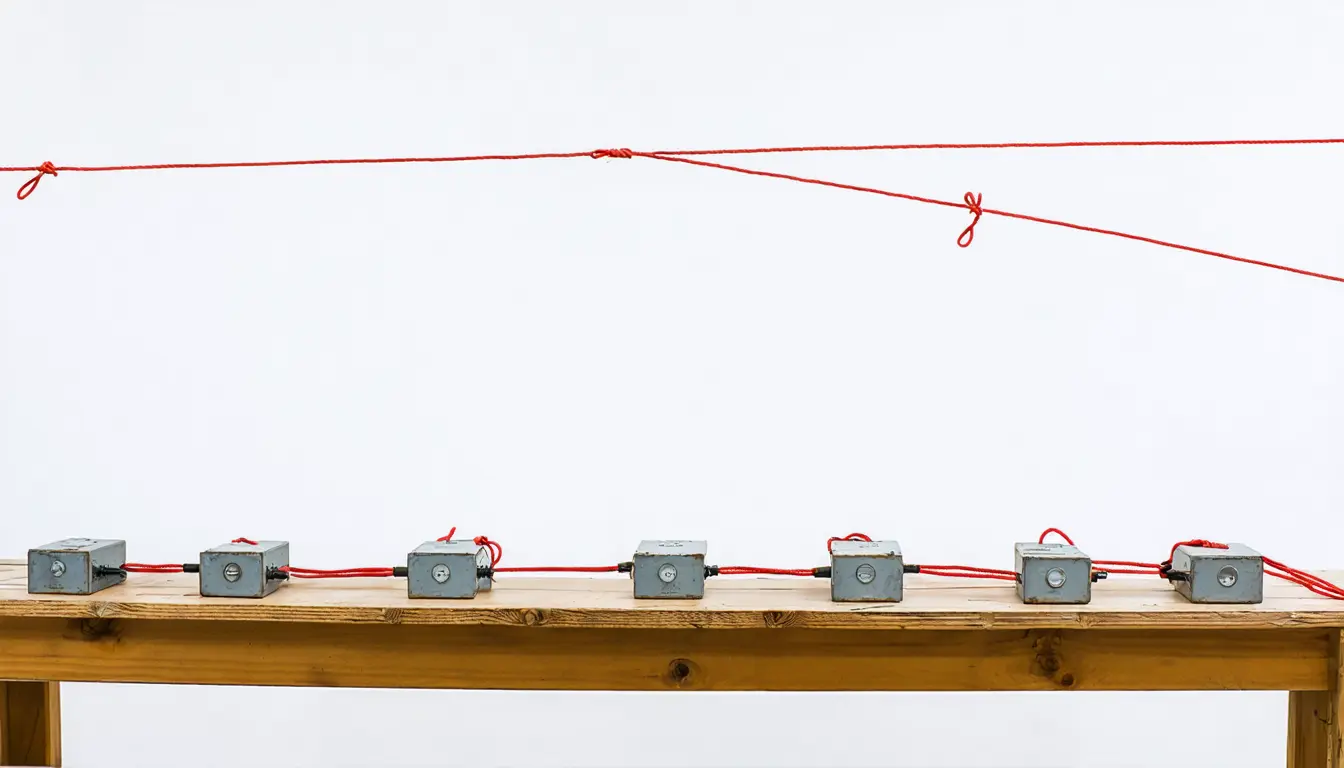
For the post's example four-step workflow, a run emits 1 span, the root span, with node spans off. With node spans on it emits 5 spans, 1 root span plus one per node, if each step is one node.
| Measure | Value | As of | Claim |
|---|---|---|---|
| Node spans off | 1 spans per run | 15 | |
| Node spans on | 5 spans per run | 15 |
What happened
- Traces export over OTLP, and the announcement lists Jaeger, Tempo, Datadog, Honeycomb, New Relic and Grafana Cloud as compatible collectors and backends.
- Configuration lives under Settings > OpenTelemetry in n8n's documentation.
- Custom span attributes can be set at the project, workflow and node levels and are passed through to the connected backend.
- The capability is designed for both self-hosted and cloud deployments of n8n.
Why it matters
- capability Per-node timing lets a team attribute delay to a specific step, so a slow external API call and n8n's own execution can be told apart.
- cost Node spans are opt-in, so each team has to decide which workflows get them, since every enabled node adds a span to what the backend ingests.
- constraint A team without an OTLP-compatible backend has to stand one up before the traces are useful, and the post itself ties the value to existing tooling.
Cost shows up as span count. Each run produces a root span [3], and node-level child spans are something users enable [8]. Take the post's own example: a customer request comes in, and the workflow queries a database, writes to a CRM and replies to the customer [9]. If each step is one node, a run emits five spans with node tracing on and one with it off [15]. The count is one plus the number of nodes, so it grows with every step added [15].
The "cross-service" part needs a closer look. According to the dev.to post, the feature lets teams follow executions from their trigger through downstream actions [10]. What the post details is n8n's side: a root span per run and a child span per node [2]. A node that calls a CRM gets its own span for that call.
Whether the CRM's own spans join the same trace depends on n8n passing trace context on outbound calls. The post does not say whether it does. If it does not, the backend shows n8n's view of each call, and the services' internals sit in separate traces.
Exporting over OTLP is the right design in our view [13]. A team with Jaeger, Tempo or a hosted backend keeps one place to look during an incident and adds no monitoring layer for n8n alone. Setup is a single settings page [5]. That holds for a team that already runs a backend, which is the context for the call.
Everything here comes from one secondary account, a dev.to summary of n8n's announcement [1]. It does not state which settings are on by default and does not give overhead figures. It says the announcement focuses on tracing capabilities and configuration, with no separate pricing terms set out [14]. Before enabling node spans across production, we'd read n8n's documentation and measure span volume on one busy workflow.
What to watch
- Whether n8n's documentation says trace context is propagated on outbound calls, which decides if downstream services' spans join the same trace.
- Whether the documentation states a default for node-level spans, and what overhead n8n reports for enabling them.
- Span volume and backend bills reported by teams running node-level tracing on high-frequency workflows.
Clarity's read
What the record supports and how the coverage leans. The claims behind it follow.
Reality
- Evidence40
- Adoption
- Insufficient
- Hype gap+10
- Incentives45
- Confidence55
Claim ledger
Ranked by verification strength, evidence, and original report placement.
- [1]
n8n introduced native OpenTelemetry tracing for its automation platform, announced on June 8, 2026, as summarized in a dev.to post pointing to n8n's official announcement.
- [2]
The capability can emit a trace for every workflow run and, optionally, a child trace span for every node.
- [3]
Each run produces a root span, which acts as the top-level record for the execution.
- [4]
The announcement describes exports to OTLP-compatible collectors and backends, including Jaeger, Tempo, Datadog, Honeycomb, New Relic and Grafana Cloud.
- [5]
n8n documents configuration through Settings > OpenTelemetry.
- [6]
The capability applies across n8n workflows and is designed for both self-hosted and cloud deployments.
- [7]
The documentation covers custom span attributes that can be applied at the project, workflow and node levels, and those attributes are made available in the connected observability backend.
- [8]
Users can also enable child spans for individual workflow nodes.
- [9]
The post's example workflow receives a customer request, checks a database, updates a CRM, and sends a response.
- [10]
The post says the feature gives teams a way to follow workflow executions from their trigger through downstream actions.
- [11]
The post says the value will depend on whether the business already operates compatible tooling and on how critical its workflows are.
- [12]
End-to-end traces make it possible to see where execution time accumulates, rather than assuming that n8n itself is the source of a delay; if an external service call is the slowest point, the trace should make that visible in the chosen backend.
- [13]
n8n users with an existing OpenTelemetry-compatible observability setup can use that environment for workflow traces rather than adopting a separate, proprietary monitoring layer.
- [14]
The post says the announcement focuses on tracing capabilities and configuration, rather than setting out separate pricing terms for the feature.
- [15]
With node spans on, a run emits 1 root span plus one span per node, so the example four-step workflow emits 5 spans if each step is one node; with node spans off it emits 1.
Sources
1 independent publisher whose own reporting we read for this story.
- dev.ton8n Adds Native OpenTelemetry Tracing for Workflow and Node-Level Visibility
1 article · October 13, 2026
Topics and entities
Follow any of these and your For You feed starts watching them — no settings page required.