Science1 distinct publisher3 min readPublished
A study in Earth's Future overlaid American landslide susceptibility with local socioeconomics for the first time. Where the maps are reddest, the households underneath them have the least money to engineer a slope or leave it.
The Scientist · Science desk

Compiled by The ScientistSomething wrong?How this is made
Start with the arithmetic, because it decides how much weight the headline share can take. At least 3.6 million exposed Appalachian residents against the national 6.5 million in high-susceptibility terrain is 55.4 percent [1], which matches the 55 percent the authors report [5] and tells you the denominator behind that share is the high-risk count [4], not the larger medium-risk one. The same check works on West Virginia. If 2 percent of the country lives in high-risk areas [7] and that 2 percent is 6.5 million people, the implied population base is about 325 million [2], which is the right order for the United States. West Virginia's 20 percent is ten times the national rate [3].
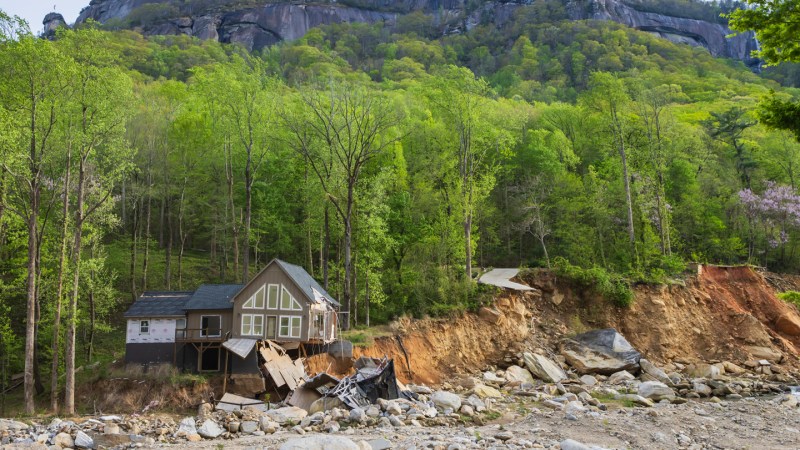
The geometry is what makes Appalachia different from a steep hillside anywhere else. The valleys are steeply walled and lush because the rains are heavy, and communities sit either on those slopes or on the valley floors below, where rock, mud and debris come to rest [6]. Exposure there is not confined to the people uphill; the runout zone is inhabited too.
Compare the coast. West Coast mountainous regions hold at least 1.7 million people at high risk, about 26 percent of the high-risk total [8][4], and the two regions together come to roughly 82 percent of it [5]. The reported categories are worded differently in places, so treat that sum as indicative rather than exact. What separates the two populations is not slope angle but response capacity: city residents in high-hazard zones are more often wealthy, and more likely to have access to engineering fixes or the means to move or rebuild afterwards [10]. Joe Wartman of the University of Washington, whose group found the highest risk where dense populations and steep slopes coincide, said the new map allows agencies to "hyper-localize" and focus on those most in danger [9][12].
The thing this design does not tell you is anything about a specific household. As described, the study classified susceptibility, overlaid homes, and assessed the socioeconomic status of those locations [3], which is an area-level association measured at one point in time. It does not establish that poverty causes exposure or that exposure causes poverty, and it does not count landslides that happened, dollars lost, or how well any individual house is built. Susceptibility is a modeled likelihood that a slope fails, not a schedule for when. Ben Mirus of the US Geological Survey, who led the agency's 2024 mapping and was not part of the study, framed the contribution plainly: once you have a map of where landslides are, you want to know why and where they matter [11].
That is where the money question enters. Landslides in the United States cause billions of dollars in damage and can take dozens of lives a year [1], and Wartman notes how hard mitigation is across terrain that large [12]. A susceptibility class orders ground by how likely it is to move. It says nothing about who can pay for a retaining wall, which is the variable that decides whether a hazard map ever becomes a built intervention. Adding local income to the overlay gives a state agency with a fixed budget an ordering it can actually spend against. It also explains the resistance: mapping is cheap next to mitigation, and in places where owners fear the designation itself [13], the cheap step is the one that gets blocked.
Ranked by verification strength, evidence, and original report placement.
At least 6.5 million people in the United States live with high landslide risk, which the study calls a conservative estimate; including populations with medium landslide risk increases that count by millions, corroborating preliminary USGS estimates of populations exposed to landslides.
At least 3.6 million people in Appalachia, including a high density of lower-income people, live in landslide-prone areas, making up 55 percent of the national total of people exposed to landslides.
Some homeowners in Los Angeles or Seattle are among at least 1.7 million people living with high landslide risk in West Coast mountainous regions, and residents of cities in high-risk zones are more often wealthy.
In 2011 lobbying halted North Carolina's statewide landslide mapping effort, which was inactive for six years, and geologists there were still making up the lost time when Hurricane Helene hit in 2024, triggering more than 9,400 landslides, mostly in that state, according to the USGS.
Landslides in the United States cause billions of dollars of damage and can take dozens of lives each year.
A study published July 29 in Earth's Future is one of the first to break down the socioeconomics of who lives with landslides in the United States, and found that people living where landslides are most likely to occur are those least able to afford to move or to mitigate the risk.
Distinct publishers with included, body-backed reporting in this cluster.
1 article · August 27, 2026
Follow any of these and your For You feed starts watching them — no settings page required.
product
Geologic hydrogen's firmest numbers come from mine vents, not reservoirs1 distinct publisher
science
Flow control gets a shared benchmark, and a 38% friction cut nobody had to simulate first2 distinct publishers
science
A San Andreas slip claim arrives without a number, and before peer review1 distinct publisher
science
Yellowstone's geysers run on water, and 15,000 years of lake mud says drought can throttle them1 distinct publisher
Evidence-backed comparisons of source perspectives and observed adoption signals. Read the methodology
Which Builder, Operator, and Investor concerns the observed source mix emphasized—not a truth score.
Evidence, demonstrated adoption, hype gap, incentives, and confidence are assessed independently, each on its own current evidence. How these are measured.
One secondary account of a peer-reviewed study, method thinly described
All claims trace to a single Science News article reporting a July 29 Earth's Future paper, with the lead author named and an unaffiliated USGS geologist providing independent comment and an external corroboration point (preliminary USGS exposure estimates). That is credible sourcing, but there is no second outlet, no access to the paper's uncertainty ranges or model inputs, and the article slides between 'high landslide risk' and 'exposed to landslides' when stating the 55 percent Appalachian share, so key numbers cannot be independently pinned down.
Base mapping deployed nationally; the new socioeconomic layer has no documented uptake yet
The hazard substrate is real and in use: USGS completed national landslide mapping in 2024 and the new study corroborates its preliminary exposure estimates. But the source documents no agency, state or municipality acting on the socioeconomic overlay itself, and the adoption record for landslide mapping generally is contested at the local level — North Carolina's program was halted for six years by lobbying, and homeowners in Juneau and Sitka have recently pushed back. Uptake is therefore institutional and partial rather than broad.
Slightly overstated by framing, not by the reporting
The reporting itself is restrained — figures are labelled conservative floors, the mitigation-capacity gap is described qualitatively, and the property-value rationale for opposing mapping is explicitly challenged by an independent expert. The mild overstatement comes from treating a single-source account of one study as a settled national accounting, and from the 55 percent headline share resting on a denominator the article uses loosely ('exposed' versus 'high risk'). No claim in the cluster promises capability or outcomes beyond what the study reportedly measured.
Researcher and agency mission interest, offset by a disclosed opposing lobby
The researchers and the USGS geologist quoted have a professional and funding stake in landslide mapping being seen as consequential, and the 'hyper-localize' quote is a self-assessment of the authors' own product. Countervailing incentives are disclosed rather than hidden: property owners and industries with a financial interest in suppressing hazard maps are named as opponents, and the publisher is a science outlet with no evident commercial position in mapping or property markets.
Moderate: credible single-source reporting, unverifiable numbers
Confidence is limited by the one-publisher cluster and the absence of the underlying paper's uncertainty figures, and by the definitional slippage around the 55 percent share and the derived composites. It is supported by dated peer-reviewed provenance, a named lead author, independent USGS comment, and corroboration against preliminary federal exposure estimates.