Cornell undergraduates find relatively low PFAS levels across 300 bodies of water in the Finger Lakes region
Cornell undergraduates screened 500-plus samples from 300 bodies of water for 24 PFAS and mapped the results. Sites over New York guidance values are largely in standing water near airports and fire training stations.
The Scientist · Science desk
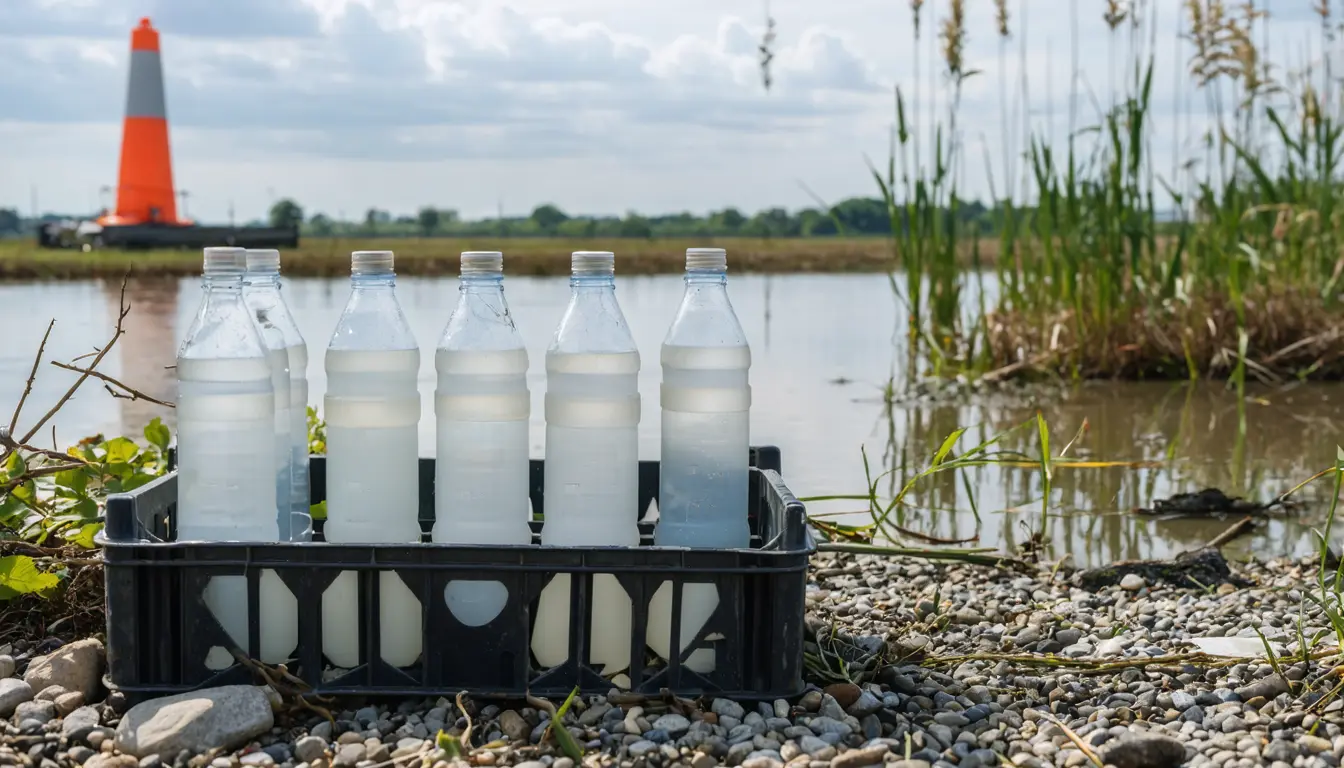
Key figures: more than 500 water samples taken by Cornell undergraduates; all 11 Finger Lakes sampled; samples screened for 24 common PFAS.
| Figure | Value | Note | Claim |
|---|---|---|---|
| Water samples taken by undergraduates, more than | 500 samples | 3 | |
| Finger Lakes sampled (all) | 11 lakes | 4 | |
| Common PFAS screened for | 24 PFAS | 5 |
What happened
- The work began in 2023, after the EPA announced limits for PFAS in drinking water and residents started asking Helbling about local ponds, lakes, streams and creeks.
- The samples covered all 11 Finger Lakes along with tributaries, ponds and puddles that persistently pool after rain.
- The students found that the region's volume of surface water seems to dilute PFAS effectively, so overall levels stay low.
- Deicing fluids and fire-extinguishing foams, both known PFAS sources, appear to spike levels at the hot spots, and the levels then decline over time.
- Those hot spots are not drinking water sources and are often isolated from other waterways.
Why it matters
- What's now possible capability Residents can now look up a surveyed pond, creek or lake on an interactive map that did not exist when the questions first came in.
- Who has to decide decision Whether the data shape New York's PFAS monitoring is the state's call; the student team says it hopes to influence it.
- What it sets up precedent The team plans to apply the same data to flag high-priority areas in other New York regions, so the method is meant to travel beyond the Finger Lakes.
The students' explanation for the low readings is dilution [7]. It is an inference from a survey. A survey can show low readings coinciding with plentiful water, but by itself it cannot separate dilution from a shortage of sources nearby.
The count is 500-plus samples, not 500-plus sites, spread over 300 bodies of water [3]. That is roughly 1.7 samples per body of water [15]. Helbling said the data set is unique in its breadth of sites and samples taken over time, set against regional PFAS data that often amount to a small number of samples at long intervals [11]. Both statements can hold. The decline at the hot spots implies repeat visits there [9]. The Phys.org account does not say how many of the other sites were sampled more than once, what the concentrations were, or how many sites were over New York's guidance values.
Before the project, Helbling had nothing local to offer the residents who contacted him. "I had no idea how to answer their questions. There were no data locally," he said [2]. Alex Van Den Hende, who first created the map's infrastructure, described the reaction to the results: "There was definitely relief knowing that generally we're not seeing elevated levels across the region," he said [13].
PFAS do not break down easily, and they accumulate in the environment and the body [14]. So a dated reference point matters, and Helbling made the argument himself. "We're getting a snapshot of water quality today that will be useful to compare with data from water samples collected after certain industries arrive," he said [12].
We think the baseline is the part of this work most likely to last, on one condition. Later sampling has to use the same sites and the same 24-compound panel [5], or the comparison will not mean much.
What to watch
- Whether New York's state PFAS monitoring program draws on the students' data.
- Resampling of the same sites after new industries establish themselves in the region.
- The team's priority-area analysis for other New York regions, and whether it reports how many sites were sampled repeatedly.
Clarity's read
What the record supports and how the coverage leans. The claims behind it follow.
Reality
- Evidence50
- Adoption20
- Hype gap−5
- Incentives30
- Confidence50
Claim ledger
Ranked by verification strength, evidence, and original report placement.
- [1]
In 2023 the EPA announced regulations to limit PFAS in drinking water, and Cornell professor Damian Helbling began getting calls and emails from residents who wanted to know PFAS levels in local ponds, lakes, streams and creeks.
- [2]
"I had no idea how to answer their questions. There were no data locally."
- [3]
Undergraduates in Helbling's research group took more than 500 samples across 300 bodies of water.
- [4]
The samples covered all 11 Finger Lakes and many tributaries, ponds and puddles that persistently pool after rain.
- [5]
The samples were screened for 24 common PFAS and the data were added to an interactive map.
- [6]
Overall, the concentrations of PFAS in the Finger Lakes are relatively low.
- [7]
The students found that the amount of surface water in the Finger Lakes region seems to effectively dilute PFAS, so that overall levels remain low.
- [8]
Hot spots, where levels exceeded New York state guidance values for safety, are largely in standing bodies of water near airports and fire training stations.
- [9]
At the hot spots, deicing fluids for planes and fire-extinguishing foams, known sources of PFAS, appear to spike the levels, which then decline over time.
- [10]
The hot spots are not sources of drinking water and are often isolated from other waterways, limiting their impact.
- [11]
Regional data on PFAS contamination in water often consist of a small number of samples taken at long intervals; Helbling said the students' Finger Lakes data set is unique in its breadth of sites and samples taken over time.
- [12]
"We're getting a snapshot of water quality today that will be useful to compare with data from water samples collected after certain industries arrive,"
- [13]
"There was definitely relief knowing that generally we're not seeing elevated levels across the region,"
- [14]
PFAS don't break down easily and accumulate in the environment and the body.
- [15]
The sampling works out to roughly 1.7 samples per body of water (a floor, since the source says more than 500 samples).
- [16]
The student team hopes to influence the state's monitoring of PFAS.
- [17]
The student team plans to use the accumulated data to identify high-priority areas in other regions of New York.
Get this ledger inside ChatGPT. Ask about any of our stories and the answer brings its figure, each claim’s verdict and the sources. Free, no account.
Sources
1 independent publisher whose own reporting we read for this story.
- phys.orgFirst in-depth map of 'forever chemicals' in the Finger Lakes created
1 article · October 15, 2026
Topics and entities
Follow any of these and your For You feed starts watching them — no settings page required.
Topics
- PFAS ContaminationFollow
- Student-led researchFollow
- Water quality monitoringFollow
Entities
- US Environmental Protection AgencyFollow
- Cornell UniversityFollow
- New York State Water Resources InstituteFollow
- Damian HelblingFollow