Science1 publisher3 min readPublished
IIASA maps 35 climate drivers onto eight key risks to make IPCC reports usable by planners
A prototype taxonomy published in Nature Climate Change links measurable climate drivers to specific risks and adaptation options. Its own numbers show most of the work happens at regional scale.
The Scientist · Science desk
Drafted by a language model from the sources cited here and checked against its claim ledger before publication. How we use AISend a correction
What happened
- IIASA researchers and partners developed a new climate impact taxonomy as part of research published in Nature Climate Change, integrating climate drivers, risks and adaptation options in one framework grounded in IPCC science.
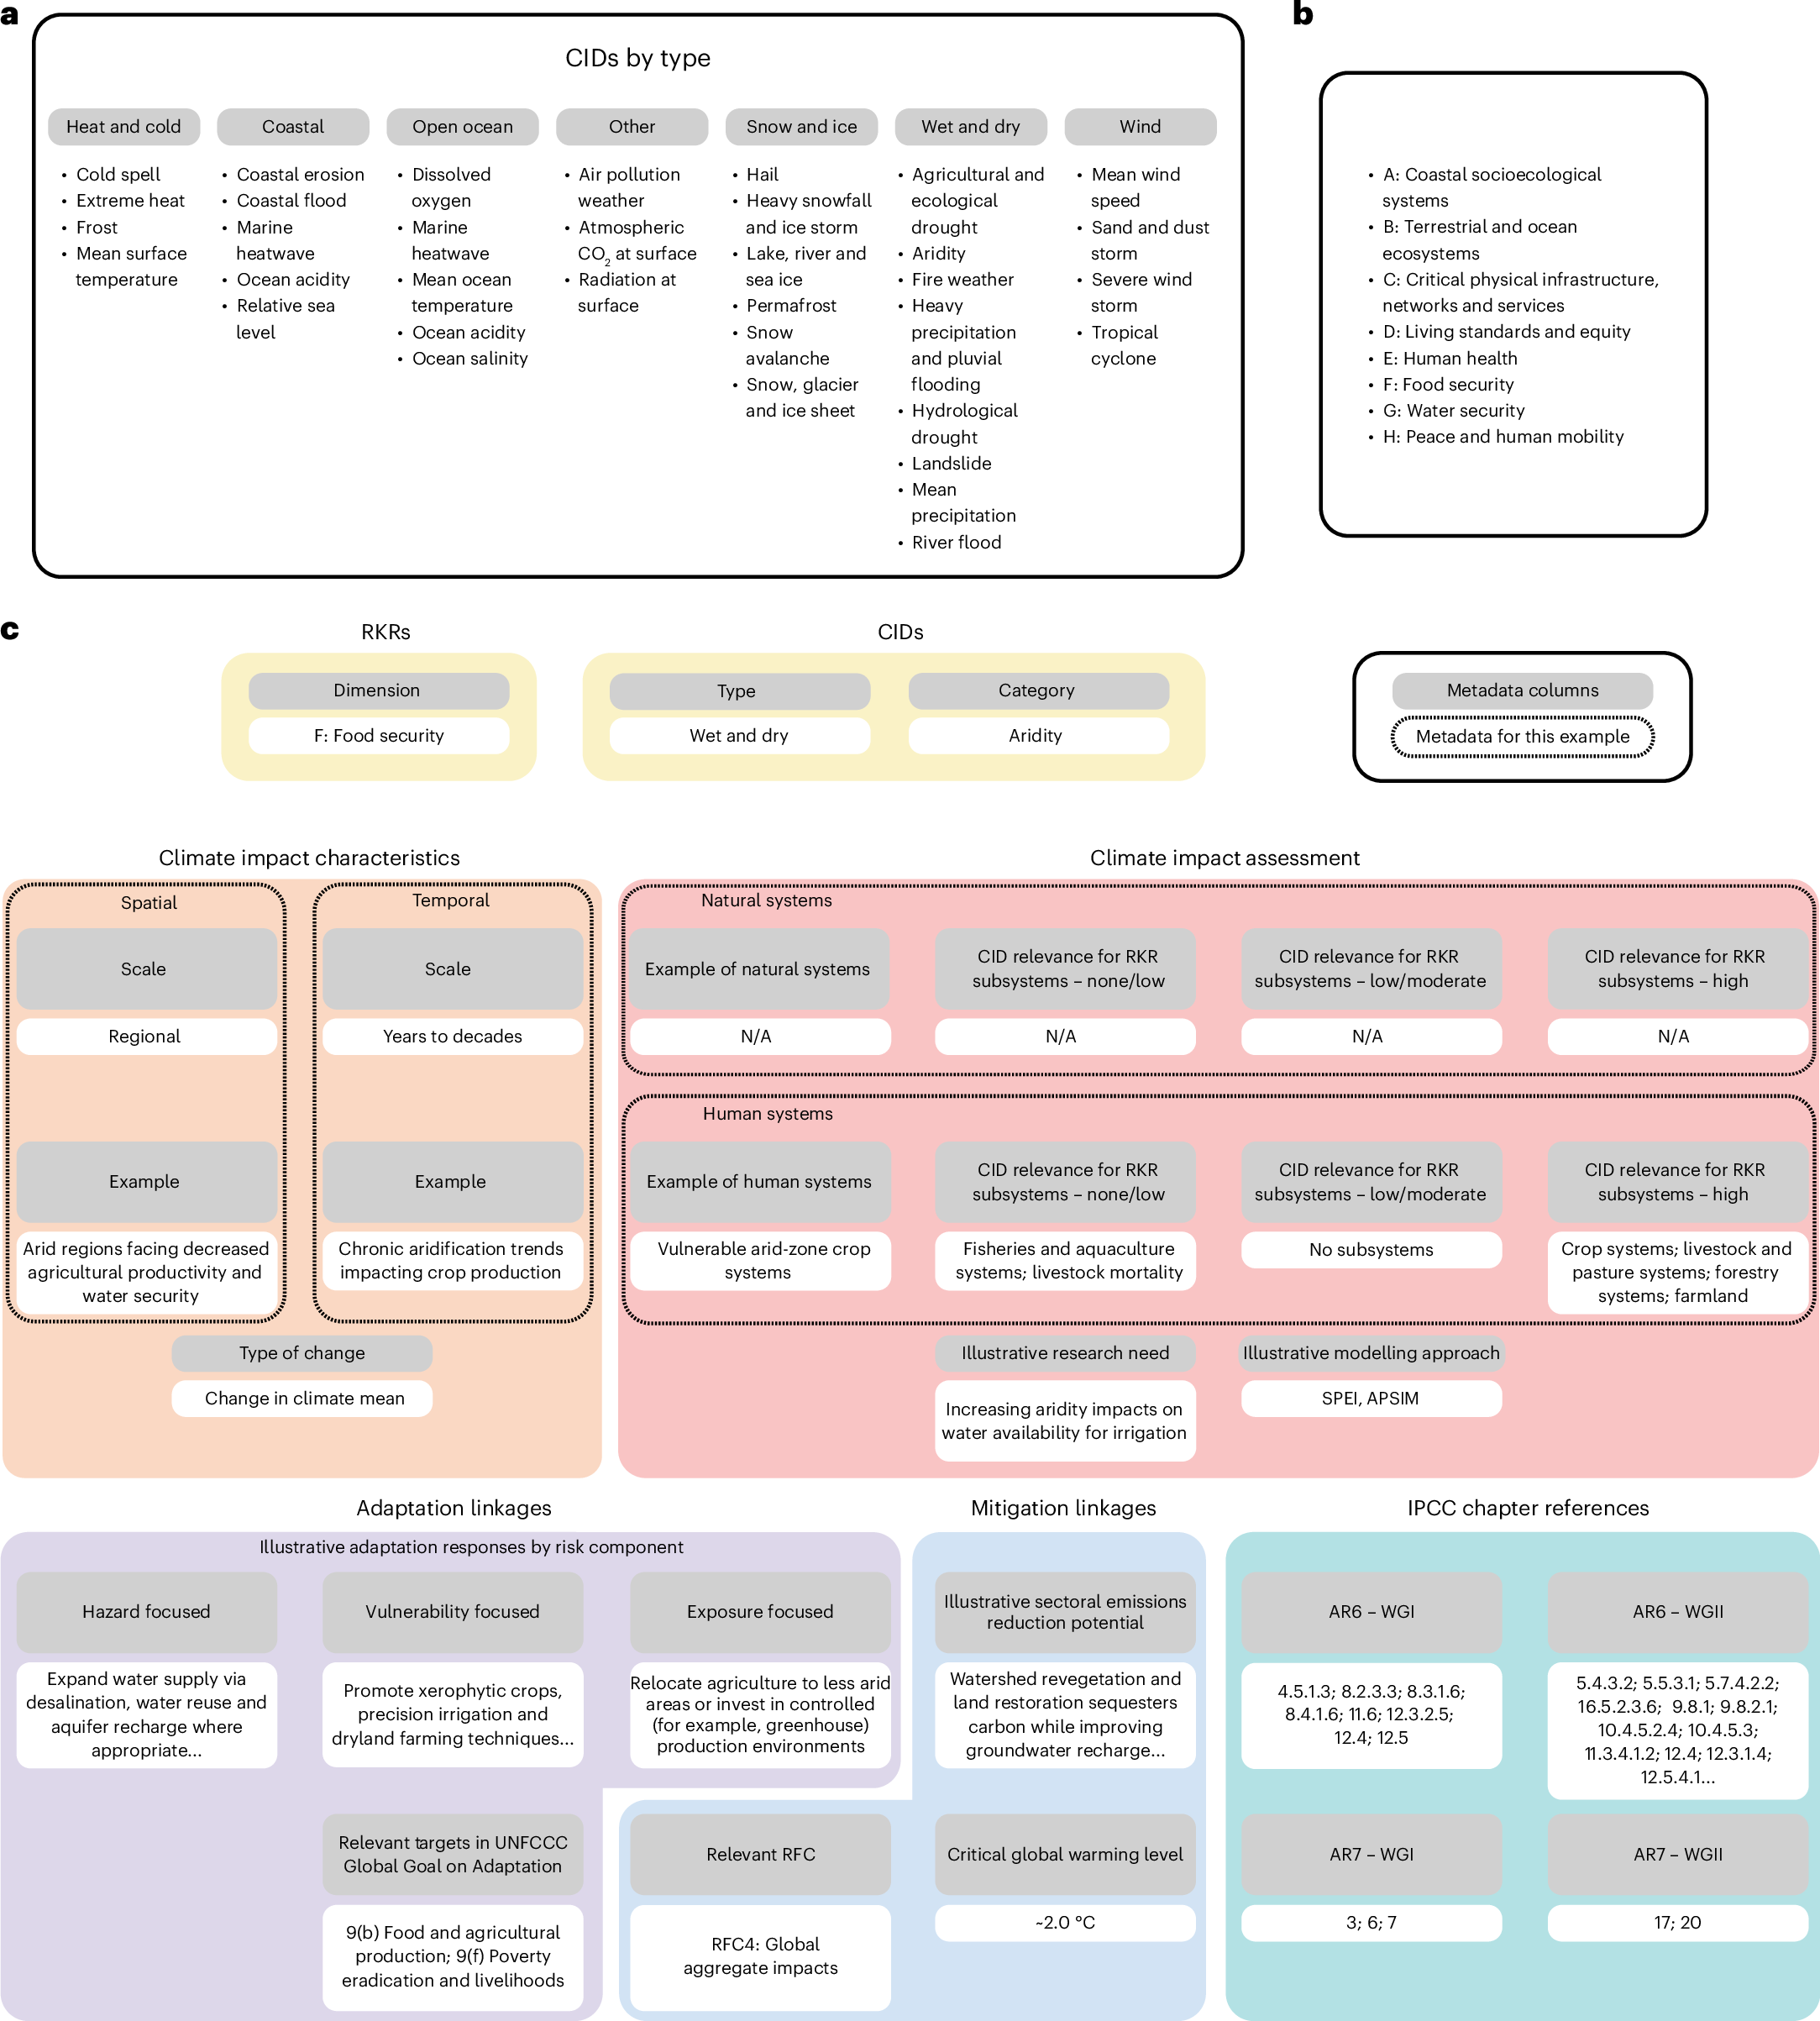
- The tool systematically connects all 35 climatic impact drivers identified by the IPCC, including physical climate conditions such as coastal flooding, drought or extreme heat, with the eight representative key risks, which describe major climate-related risks to ecosystems, infrastructure, food security, water resources, cities and human well-being.
- IPCC assessment reports provide a wealth of scientific information, but there has been limited integration between the physical science of climate change and the assessment of its impacts and adaptation options, and practitioner-oriented products translating IPCC concepts into actionable information have been missing.
- Lead author Michaela Werning, a researcher in the IIASA Energy, Climate, and Environment Program, said the work is less about producing new climate science than about making existing information actionable, that navigating the IPCC reports can be challenging due to their scope and complexity, and that the taxonomy provides an easier entry point by directly linking measurable climatic impact drivers to specific risks and adaptation responses.
- Each connection in the taxonomy is enriched with practical information, including the scale at which impacts occur, the systems affected, examples of adaptation responses, links to mitigation options, and references to the relevant IPCC chapters.
Compiled by The ScientistSomething wrong?How this is made
Why it matters
IIASA researchers and partners have published a climate impact taxonomy, part of research in Nature Climate Change, that connects all 35 climatic impact drivers identified by the IPCC to the eight representative key risks the panel uses to summarise threats to ecosystems, infrastructure, food security, water resources, cities and human well-being [1][2]. The exercise produces no new climate science; it produces an index, aimed squarely at the standing complaint that IPCC assessments are authoritative and awkward to use at the desk where a drainage contract or a heat plan is written [3][4].
The structure matters more than the framing. Each driver-risk connection carries the scale at which impacts occur, the systems affected, examples of adaptation responses, links to mitigation options, and references to the relevant IPCC chapters [5]. That last field is the operationally useful one: a pointer back to a specific chapter is what lets an engineer or a procurement officer defend a design assumption to an auditor. Thirty-five drivers against eight risks gives a matrix of at most 280 cells [6], which is small enough to sit inside a dashboard and large enough that nobody was navigating it by hand before.
The compiled patterns are the part planners should read first. More than half of the hazard-risk combinations primarily play out at regional scales, according to the researchers, reflecting unique regional conditions [7]. Read plainly, that means a global taxonomy tells you which cell to look in, not what number to write into a specification. The authors also report an almost even split between gradual climate change and extreme events, and argue that capacity is needed both for handling events and for planning on longer time scales [8]. Those are two different budget lines: standby response capacity on one side, asset design life on the other.
On warming levels, just under half of the driver-risk combinations are expected to reach high levels of risk at around 1.5 degrees C of global warming, with a similar proportion crossing that threshold beyond 2 degrees, which the team presents as evidence that mitigation and adaptation are both required [9]. The taxonomy also flags where evidence remains thin, which doubles as a research priority list [10].
Intended users are climate service providers building tailored risk dashboards, adaptation planners selecting response options, and policymakers tracing how emissions cuts now reduce sectoral risk later [11]. Seth Monteith, co-author and director of advisory and insights at ClimateWorks Foundation, argues that a shared language and framework will be increasingly critical as impacts become more frequent [12]. Lead author Michaela Werning of the IIASA Energy, Climate, and Environment Program describes the taxonomy as an easier entry point into reports whose scope and complexity make them hard to navigate [4].
Two cautions. The team calls this a prototype [13]. And the announcement reports proportions rather than counts, and says nothing about file format, licensing, or how the taxonomy will be refreshed as assessment cycles turn over [14] - all of which decide whether this becomes a data dependency or a PDF.
Watch for a machine-readable release with a licence attached, and for the first climate service provider that ships a dashboard built on these 280 cells rather than on its own bespoke mapping.