Science1 publisher3 min readPublished
Greening drylands swing harder between wet and dry years than 13 vegetation models predict
University of Arizona researchers find about 80% of the world's drylands swinging harder between wet and dry years across four decades of satellite data. Forecasts for rain-fed farms and rangelands built on the 13 vegetation models they tested assume steadier plants than the satellite record shows.
The Scientist · Science desk
What happened
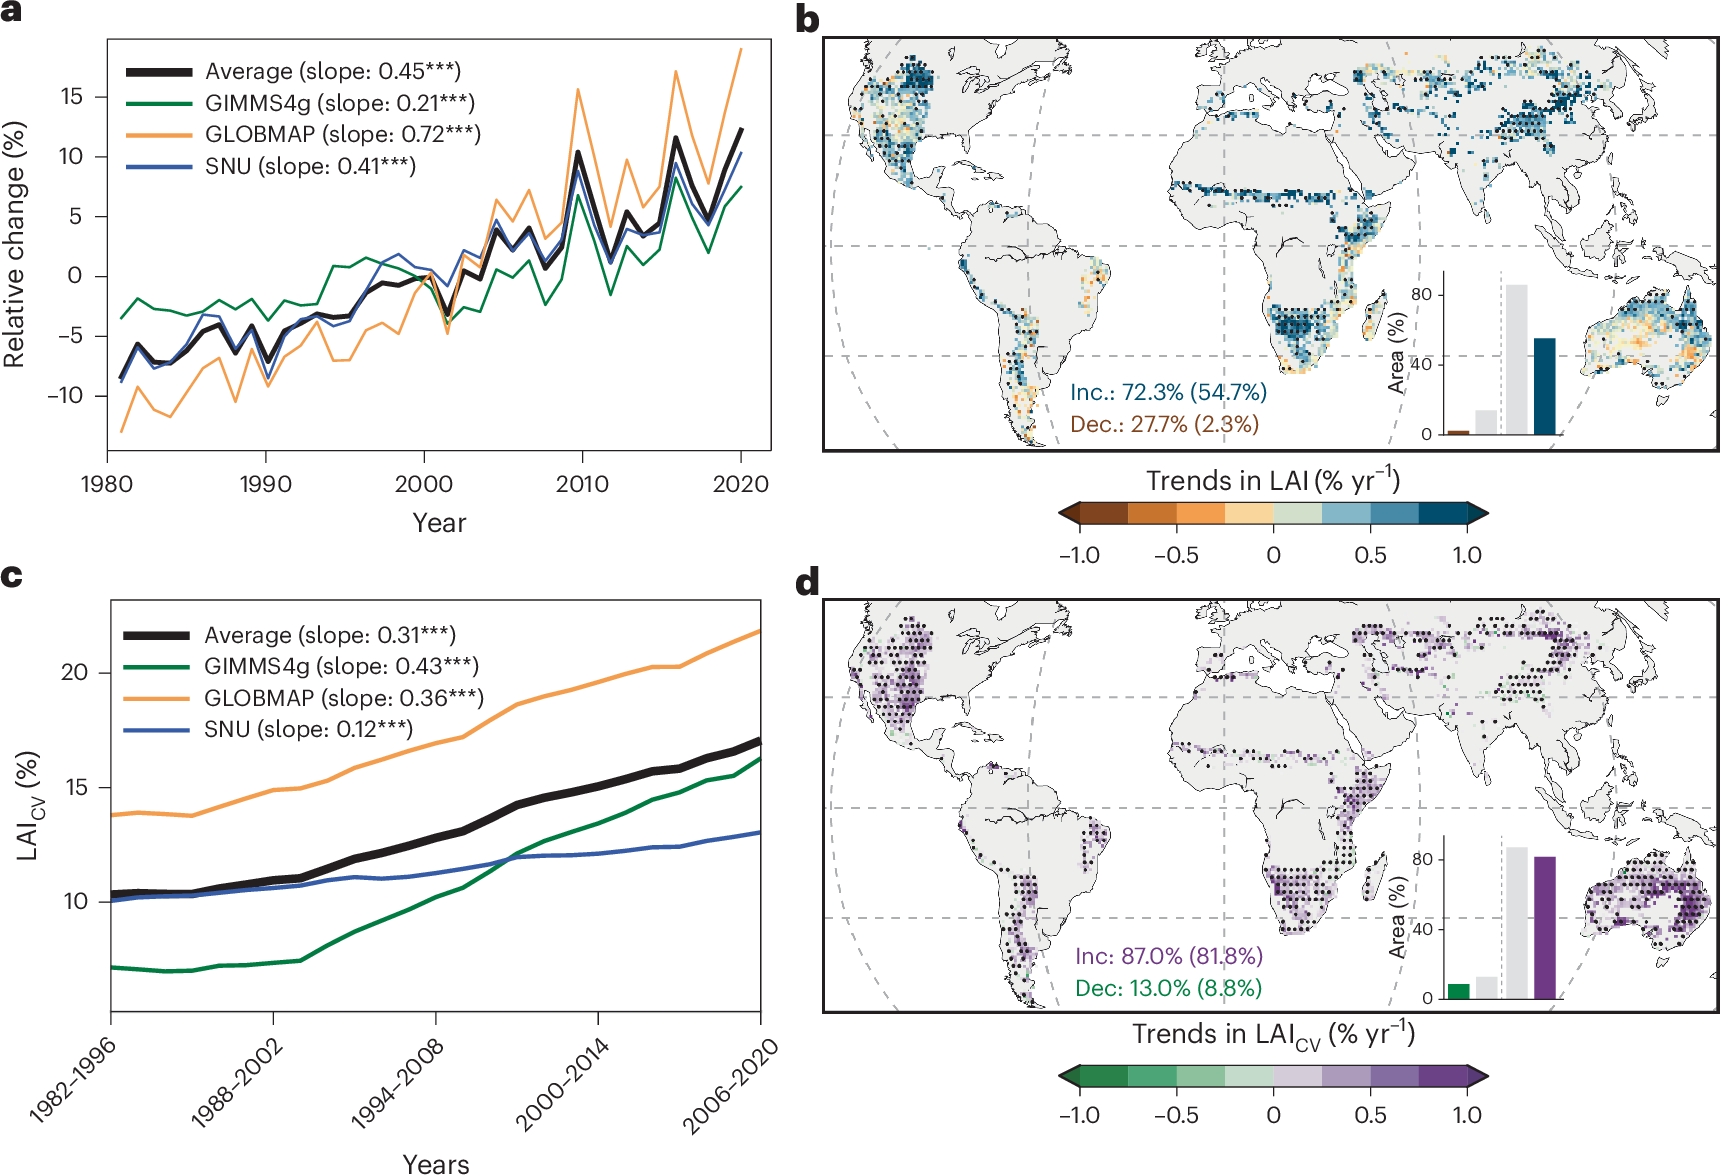
- University of Arizona researchers report that roughly 80% of the world's drylands show escalating instability in plant growth from one year to the next.
- Over four decades, rising carbon dioxide has driven extra leaf growth in wet years, producing a persistent greening trend across drylands.
- That greening trend hides severe year-to-year swings that leave dryland ecosystems especially exposed when a dry year arrives.
- Doctoral student Wen Zhang's team tracked leaf area index, a satellite measure closely tied to plant productivity, across 40 years of records.
- The team tested 13 leading global vegetation models against the record, and none reproduced the observed rise in year-to-year variability.
Compiled by The ScientistSomething wrong?How this is made
Why it matters
- constraint Projections of dryland forage and crop output built on these 13 models will understate how deep a dry-year loss can go, since none of them reproduces the widening swing.
- cost Rain-fed growers facing wider swings may have to pay for more irrigation to hold yields steady, a cost that a rising average leaf-area trend hides.
- decision Rangeland managers who set stocking levels from the long-run greening trend would overshoot in dry years, so the planning figure has to become the dry-year floor.
- capability If Moore's early-warning reading holds, rising variance in satellite leaf-area records could be used to flag drylands losing resilience before a larger change shows up.
A trend line through forty years of leaf area index can climb while the gap between the best and worst years widens. The University of Arizona team's record shows both happening together [2][5]. "The upper and lower extremes are getting farther and farther apart as time goes by," Zhang said [7]. "Vegetation activity is increasing during wet years, but dry years are hitting plants harder," she said [8].
Drylands are 40 percent of Earth's land surface and support more than 2 billion people [1]. If the roughly 80 percent share of drylands with escalating instability is counted by area [6], the affected ground comes to about 32 percent of all land [19]. The press account does not say how far the wet-dry spread has widened, or what threshold separates escalating instability from ordinary year-to-year noise.
The cause is less settled than the pattern. The account attributes the wet-year greening to rising carbon dioxide [4]. For the swings themselves, Zhang said the cause may be increasing CO2 acting together with variable rainfall, and that more data is needed to establish the precise drivers [9]. Leaf area measured from orbit records the pattern. It does not by itself apportion the effect between the two. Her working hypothesis is about plant size. "There's some evidence to suggest that under high atmospheric CO2, plants can become more efficient with their water use, which allows them to grow more leaves," she said [10]. "But larger vegetation requires more resources to maintain, so when a moderate drought hits the following year, these larger plant structures need more resources than are available, which leaves them far more sensitive and vulnerable." [11]
Zhang's explanation for the model failure is that the models build in steadiness [12]. "The models assume drylands are still stable and that plants will respond to changes in atmospheric carbon dioxide and rainfall in predictable ways," she said [13]. Of the study's claims, I would put the most weight on this one. It compares simulations directly against an observed record, and the result held across all 13 models [12]. A model scored on the long-run greening trend could pass that test and still get the variance wrong. Planners need the variance.
Bill Smith, the study's senior author, put it in terms of grazing. "Higher variability in forage production presents a significant challenge for rangeland managers," he said [16]. "Ranchers depend on stable forage production so they can accurately plan out their land needs each growing season," he added [17]. In rain-fed farming regions such as the American Southwest, according to the account, wider swings may push growers toward heavier reliance on irrigation [15].
David Moore, a co-author, suggested the swings may be an early sign of larger ecological change [18]. "If you look at lots of different ecological systems, their productivity tends to flicker on and off right before a big change happened. It's a sign that they're under stress and losing their resilience. It's possible that's what's happening with drylands," he said [18].
What to watch
- The paper's own figures on how much the wet-dry spread has widened, region by region, and how that tracks CO2 against changes in rainfall variability.
- Whether any of the 13 model groups changes how its simulated vegetation carries extra leaf into a drought year, and whether the revised model then reproduces the observed swings.
- A check of the satellite trend against ground records of forage or crop yield in rain-fed regions such as the American Southwest.