Science1 publisher2 min readPublished
NTU study maps South America's flying rivers as drainage basins with headwaters and outfalls
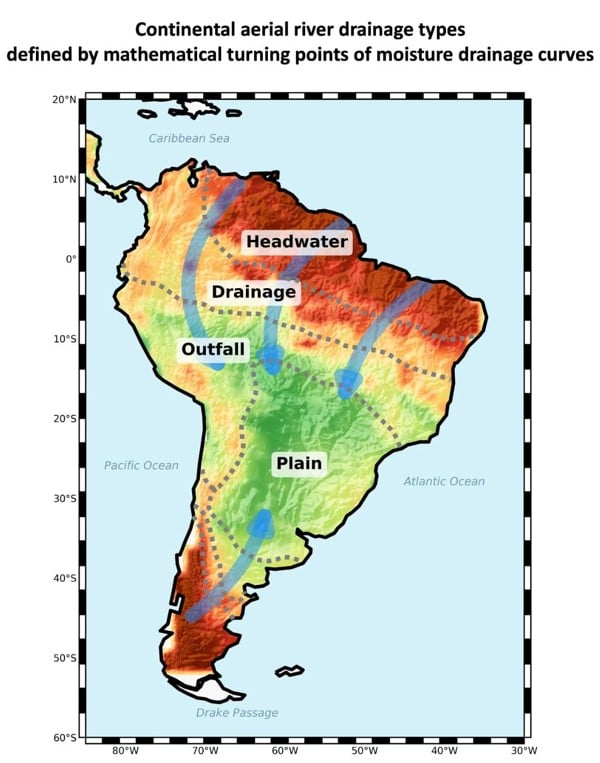
National Taiwan University researchers find South America's 'flying rivers' of airborne moisture form four drainage regions like river basins on land. Their turning-point method draws an upwind source boundary for each region's rain, a starting map for water planners.
The Scientist · Science desk
Drafted by a language model from the sources cited here and checked against its claim ledger before publication. How we use AISend a correction
What happened
- Earlier studies picked important moisture source areas using fixed thresholds, so their answers shifted with whichever threshold the analyst chose.
- The study, led by National Taiwan University, analysed long-term atmospheric moisture transport across South America and is published in Nature Communications.
- The group is extending the approach beyond South America and building a global dataset of aerial-river drainage systems.
Compiled by The ScientistSomething wrong?How this is made
Why it matters
- constraint Because the turning point lands in very different places across South America, a planner cannot borrow a neighbouring region's cutoff and has to compute the upwind basin for each target separately.
- exposure Rain in one watershed or jurisdiction depends on land managed by another, so plans drawn on surface watersheds or administrative borders leave part of their water supply outside their control.
- decision Water agencies that plan only by surface watershed now have a published, threshold-free method for adding an upwind source area to their plans.
Land past the turning point still feeds rain in the target region. What drops is the efficiency: beyond the bend, each extra stretch of source area contributes progressively less to rainfall downwind [4]. The critical upwind basin is the area inside that point of diminishing returns, and the shape of the data locates it [4].
Wei Weng, a professor in NTU's Department of Geography and the paper's first author, described the gap the method fills [12]. "Our earlier research showed that land-use change can affect water availability far downwind through flying rivers. What was still missing was an objective way to identify which upwind areas matter most," Weng said [13]. The approach, Weng said, "brings the concept of aerial rivers closer to practical application in water-resource management" [14].
That word "closer" is accurate. The moisture involved can fall as rain hundreds or even thousands of kilometres from where winds picked it up [11]. A manager trying to protect downwind rainfall wants a distance and a map. The phys.org account does not report how large any critical basin turned out to be, or which moisture record the team analysed. The causal step also sits outside this paper. By Weng's account, the finding that upwind land-use change alters downwind water comes from the group's earlier work [13]. This study shows where a region's moisture comes from, and the point at which adding more source area starts contributing less efficiently [4].
Kai-Chih Tseng, a professor in NTU's Department of Atmospheric Sciences and a co-corresponding author, linked the regions to how moisture behaves in transit [12]. "These patterns emerge from the accumulated behavior of atmospheric moisture over long time scales. As moisture moves across the continent, changes in transport and recycling processes generate distinct regions within the aerial river system," Tseng said [6]. Li-Pen Wang, a civil engineering professor and the third co-corresponding author, said statistical analysis lets the team find patterns in the data and "translate them into quantitative criteria that can be compared across regions" [7][12].
I think the method does what it claims and draws the boundary objectively [4]. Before agencies spend money protecting forest inside that boundary, they will need the basin sizes for their own regions. They will also need a test showing that land-use change inside the basin moves downwind rainfall more than the same change outside it.
What to watch
- Whether the Nature Communications paper reports critical-basin sizes or distances for specific target regions, which managers would need before drawing protection zones.
- Whether turning points in the planned global dataset vary as widely outside South America as the team found inside it.
- Any study testing whether land-use change inside a critical upwind basin changes downwind rainfall more than the same change outside it.