Invest1 distinct publisher3 min readPublished
New York State and Erie County covered 38.6 per cent of Highmark's $2.2 billion cost, barely half the fifty-year median public share, and the seat count still fell by 16 per cent. That gap is the story.
The Investor · Invest desk
Compiled by The InvestorSomething wrong?How this is made
Divide the $850 million of state and county money by the 11,500 seats that came out of the building and the public paid roughly $73,900 for each seat it lost [21]. The companion figures are calmer and more useful: $14,141 of public money per surviving seat [22], and $36,600 of total construction cost per seat once the full $2.2 billion is spread across 60,108 of them [23].
The licences carry the rest. At the top advertised rate of $50,000 a seat [6], 17,000 licences would cover the entire public contribution, which is 28.3 per cent of the seats in the building [26]. "As high as" is doing real work in that sentence, since the source gives a ceiling and not a distribution, and it does not say who keeps the licence proceeds, which is the term I would want before calling any of this a transfer.
The mechanism, though, is not in dispute. Premium seats and luxury boxes stay with the individual team in most leagues while television and merchandise money is pooled [12], so the one line an owner can maximise without splitting it is the line that requires fewer and richer seats, which is why Victor Matheson of the College of the Holy Cross describes the business as super premium experiences rather than putting people in seats [15]. Average NFL ticket prices rose 173 per cent in real terms between 2015 and 2025 [13].
The aggregate has a pace problem as well. The $33 billion spent between 1970 and 2020 [8] averages about $660 million a year [27], and the more than $13 billion of subsidies teams proposed during 2024 alone [10] runs at nearly twenty times that rate [28], although proposals are not appropriations and the source is counting what was asked for.
The complication sits in the same file. The $850 million is, per Fortune, the largest public subsidy ever committed to an NFL facility [4], and yet at 38.6 per cent of a $2.2 billion build [24] it is about 53 per cent of the 73 per cent median public share recorded across fifty years of major-league venues [9][25]. The dollar figure grew because the buildings did, while the share fell and the seat count fell 16.1 per cent with it [29].
This is probably wrong in one direction, but I read Buffalo as a purchase of scarcity rather than of capacity: the public financed the supply constraint that makes a licence worth quoting at $50,000. The counter-thesis is demand, and FIFA is making it at scale, claiming 500 million requests against 7 million tickets [17], about 71 to one [30], which would make smaller-and-dearer a response to a queue rather than its cause (the 130,000 seats Gianni Infantino offered at $60 are under 2 per cent of that supply [18][31]). What would break my read is a venue that opens with more general seats and cheaper real tickets, which Matheson says has not yet happened [11], and Kansas City, expected to carry roughly 15 per cent fewer seats than Arrowhead [14], will not be the counterexample. If the ceiling price holds, 17,000 licence buyers will have financed the building for the other 43,108 seats [32].
Ranked by verification strength, evidence, and original report placement.
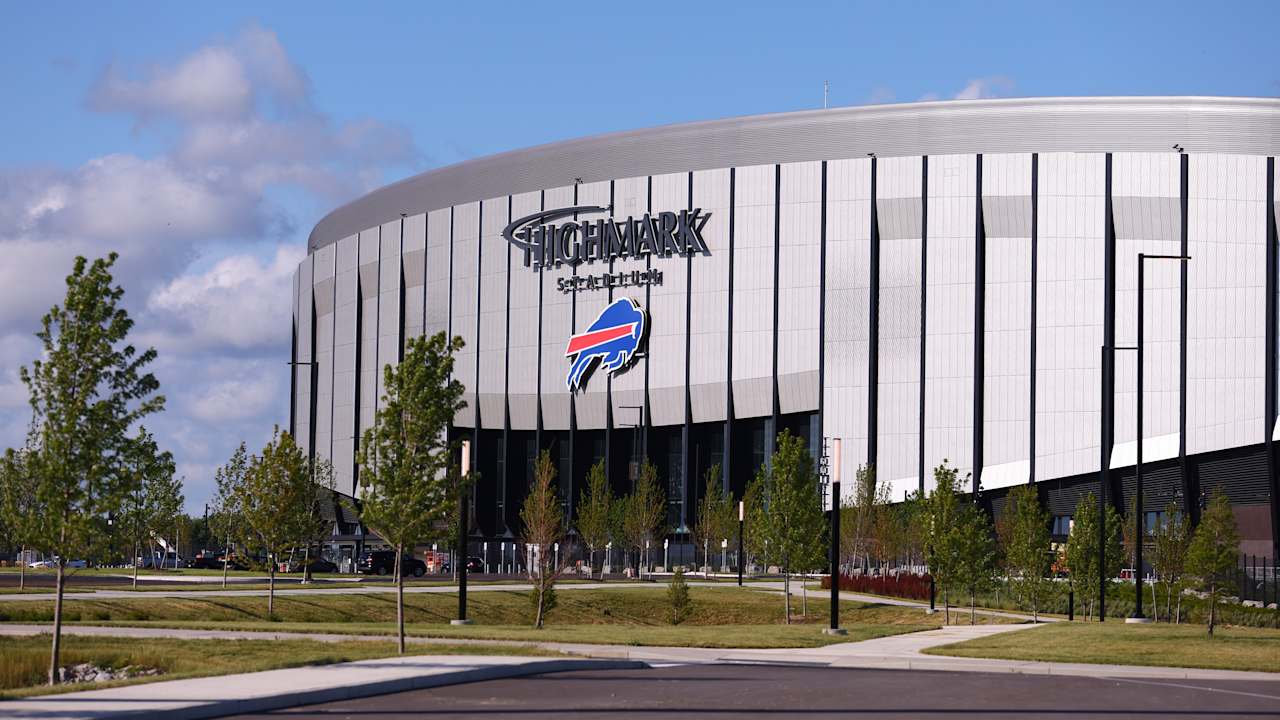
The Buffalo Bills' $2.2 billion Highmark Stadium opens in September as the NFL's smallest venue, with 60,108 seats.
The old Buffalo stadium held 71,608 seats.
New York State contributed $600 million and Erie County $250 million, a combined $850 million in public funds toward the stadium.
The public funding resulted in 11,500 fewer seats than the old stadium held.
Personal seat licences at the new stadium, which grant the right to buy season tickets, run as high as $50,000 per seat.
Get-in prices for opening night have already listed at $663 on the resale market.
Distinct publishers with included, body-backed reporting in this cluster.
Follow any of these and your For You feed starts watching them — no settings page required.
invest
A CEO's $1,000 weekend, and the auto-renew setting that made it possible1 distinct publisher
invest
Apple clears two bad bets off the books a week before Ternus takes over1 distinct publisher
product
Nevada granted Tesla 10 robotaxis after a 5,000-vehicle request1 distinct publisher
invest
Amazon stopped eating the memory bill, and the Echo Dot went up 60%1 distinct publisher
Evidence-backed comparisons of source perspectives and observed adoption signals. Read the methodology
Which Builder, Operator, and Investor concerns the observed source mix emphasized—not a truth score.
Evidence, demonstrated adoption, hype gap, incentives, and confidence are assessed independently, each on its own current evidence. How these are measured.
One outlet, checkable arithmetic, no documents
The facts are specific and internally consistent — every derived figure in our coverage reconciles against Fortune's own seat counts, dollar totals and percentages. What is missing is anything outside Fortune: no appropriation record for the $600 million or the $250 million, no lease, no named source for the 173 per cent price series or the $33 billion study, and one economist carrying the interpretive load. The record-subsidy label and FIFA's 500-million-requests figure are the two places where a single assertion is doing the work of a citation.
A pattern shown twice and priced everywhere
The shrink-and-monetise model is documented at two venues — Highmark's 16 per cent capacity cut and the Chiefs' expected 15 per cent — plus a decade of NFL prices tripling in real terms and FIFA repricing 90 of 104 World Cup matches. That is a real trend, not a single anecdote. But Fortune's claim that new NFL, NBA and MLB buildings 'consistently' follow it is asserted rather than enumerated, and no count of seat licences sold tells us whether the premium model is clearing at these prices.
Framing outruns the causal record
The $73,900-per-seat-removed number that heads our coverage divides public dollars by lost seats, two quantities the reporting places together without ever showing that the subsidy bought the shrinkage — owners were cutting capacity in privately financed buildings too. Fortune's own numbers cut against its record-subsidy billing as well: at 38.6 per cent, Buffalo's public share is barely half the 73 per cent median it reports a paragraph later, so the deal is a record in nominal dollars and unremarkable as a share. Underneath the framing the structural argument holds up well, which is why the gap is a lean, not a chasm.
The unshared revenue line explains the building
Rarely is a story's incentive structure this legible. Suite and premium-seat money escapes league pooling while television and merchandise money does not, so the one stream an owner keeps whole is the one that rewards tearing out bleachers — Matheson says as much in plain terms. On the public side, Fortune argues Buffalo was never realistically going to lose the Bills, making $850 million a payment against a threat that was not live, and Infantino's 'apply market rates' defence is the same logic wearing a different badge. The reporting names these pressures rather than leaving them to inference, though it never turns the lens on the owners' or FIFA's own account.
Solid on mechanism, unaccompanied on facts
We are confident about the direction of travel — capacity down, premium up, prices up — because the mechanism is coherent and three independent-feeling data points align with it. We are much less confident about individual magnitudes, since every one traces to a single Fortune piece with no documents attached and no party in the deal on record. Nothing in front of us contradicts the story; nothing corroborates it either.