Science1 publisher2 min readPublished
Outbreak Risk Typically Highest in Farm-Forest Mosaics, but Drivers Vary Across 32 Diseases
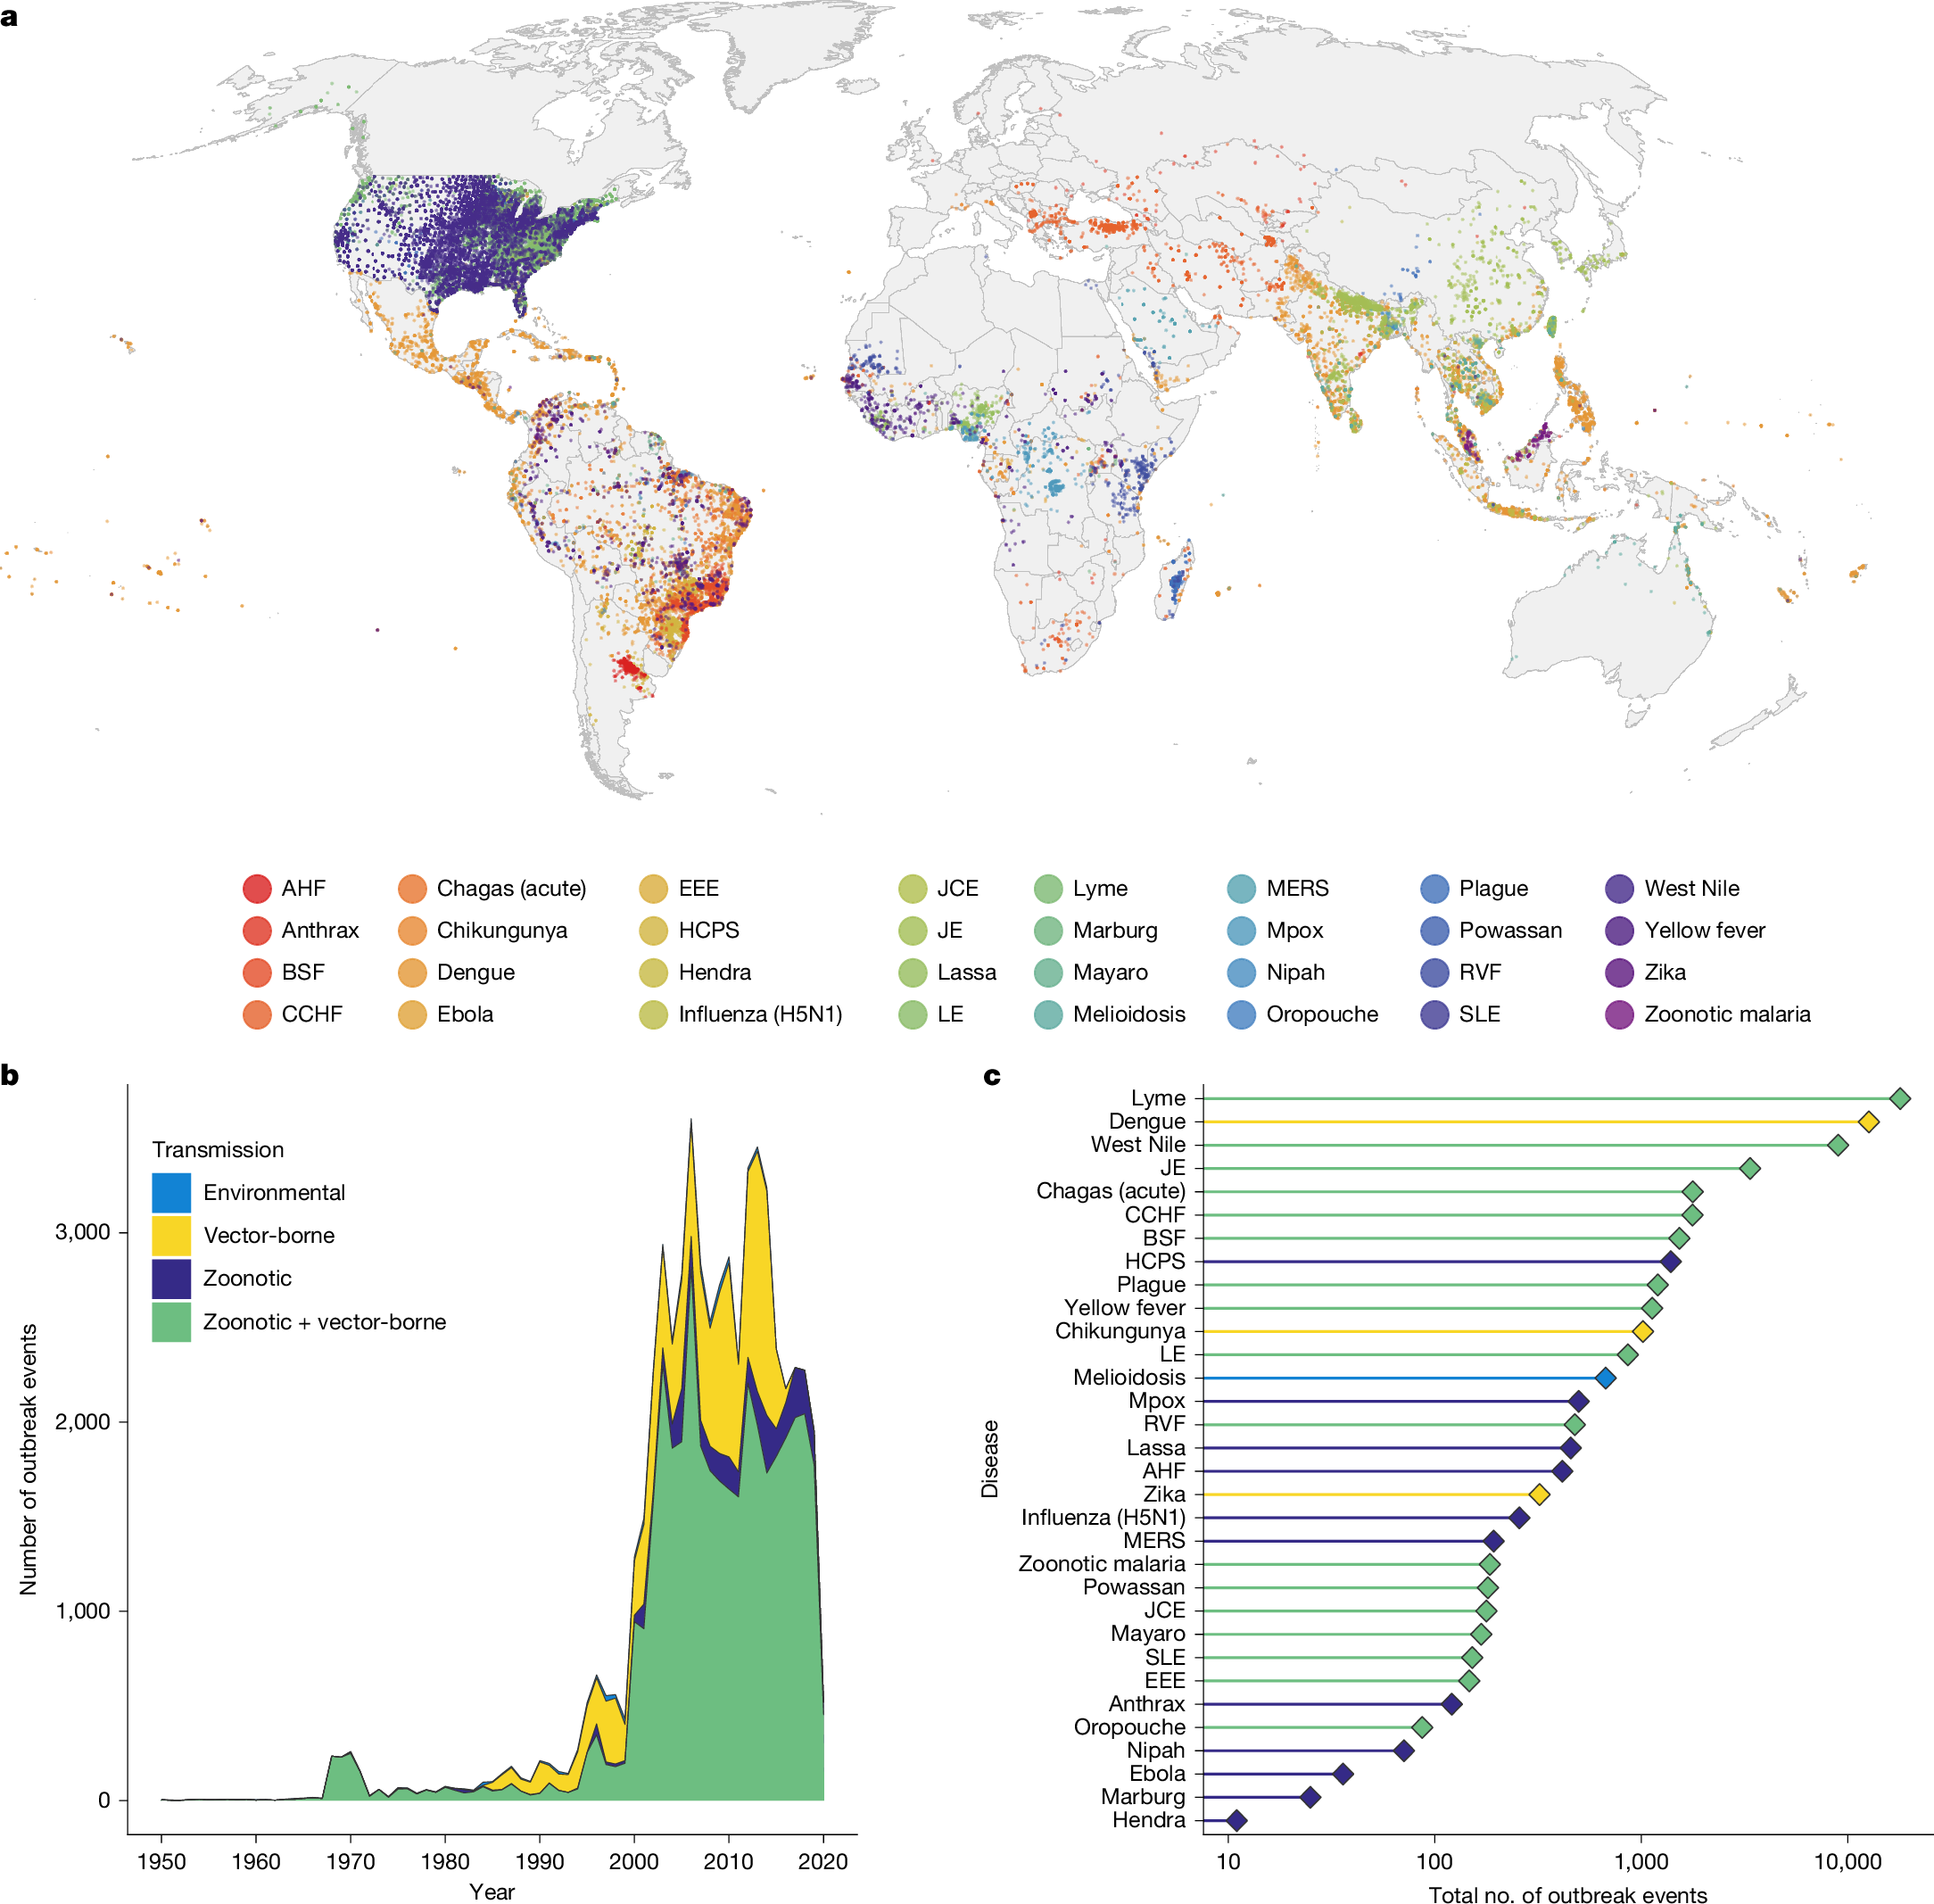
A Nature analysis of 58,319 outbreak records finds the strongest shared signal in mosaic landscapes of people, livestock and fragmented forest, while its most consistent single driver is travel time to a clinic.
The Scientist · Science desk
What happened
- Researchers pooled 58,319 outbreak event records covering 32 diseases and tested 16 hypothesized social and environmental drivers against them while correcting for detection and reporting bias.
- Deforestation, climate warming and agricultural intensification showed impacts that varied widely from disease to disease.
- The most consistent influence on observed outbreak geography was healthcare access, with reporting falling a median 32% for each extra hour of travel to a health facility.
Compiled by The ScientistSomething wrong?How this is made
Why it matters
- constraint A surveillance budget written against one generic climate-risk variable cannot be tuned to drivers whose size changes between dengue and Ebola. The targeting has to be built disease by disease.
- exposure Populations hours from a clinic are under-counted in the same outbreak datasets used to site surveillance, so allocation built on those maps understates the places least able to report.
- capability With 16 drivers scored across 32 diseases under one bias correction, planners can ask which pressure matters for which pathogen instead of arguing from a handful of well-studied systems.
- decision Funders weighing land-use intervention against clinic and One Health capacity now have a published basis for buying both, and grounds to ask for system-specific evidence before buying either.
The most consistent pattern in the paper is about measurement. Reporting of outbreaks fell by a median of 32% for each additional hour of travel time from a health facility, and across the 32 diseases that figure ran from 1.2% to 96.7% [6]. That describes where outbreaks get recorded, not where they happen. The authors modelled detection and reporting bias alongside the 16 hypothesized drivers they tested [1].
96.7% against 1.2% is roughly an eighty-fold difference [2]. For one disease, distance to care barely distorts the observed map; for another, almost nothing beyond a few hours' travel reaches the record at all.
Denominators next. 58,319 records spread across 32 diseases averages about 1,822 per disease [1]. The abstract does not break the total down by disease, so the evidence behind any single disease's driver ranking is thinner than the headline count suggests, and unevenly so.
Risk was typically highest in mosaic landscapes where people and livestock live alongside forests and fragmented ecosystems [2]. Those factors, together with long-term declines in precipitation, had strong shared impacts across several vector-borne diseases, among them dengue, Lyme disease and zoonotic arboviruses [3]. Directly transmitted zoonoses behaved differently: Ebola and mpox shared few common drivers [4].
On deforestation, climate warming and agricultural intensification, the finding is heterogeneity. Their impacts varied widely between diseases [5]. Earlier syntheses had pointed the same way, finding that ecosystem degradation and biodiversity loss tend to increase wildlife disease prevalence while the net effects of habitat fragmentation, agriculture, urbanization, deforestation and climate change may be unpredictable and context-specific [9]. This study, published in Nature, puts that heterogeneity to a test across 32 diseases at once [10].
The analysis ranks how strongly each driver is associated with the geography of recorded outbreaks, an observational result and not an experiment [1]. It cannot tell you how many outbreaks an intervention would prevent. A line item for forest-edge surveillance would still need per-system evidence before anyone can price its effect.
The authors concluded that spillover and emergence are multi-causal and that "no one-size-fits-all strategy can prevent epidemics and pandemics" [8]. They wrote that ecosystem-based public health interventions should always follow system-specific evidence, and should be paired with greater investment in health systems and One Health pathogen surveillance [7].
What to watch
- Per-disease record counts and driver rankings in the supplementary data, which would show which of the 32 diseases carry the shared vector-borne signal.
- Whether hotspot maps used to allocate surveillance funding are re-fitted with travel time to care as an explicit reporting term.
- Any prospective test in a mosaic landscape measuring whether a land-use or vector intervention lowers dengue or Lyme incidence.