Science1 distinct publisher3 min readPublished
Peat gives off roughly three times the fine particulate matter of other tropical forest fires, so most of this season's health cost is decided by how much soil is already dry and when the rains return.
The Scientist · Science desk

Compiled by The ScientistSomething wrong?How this is made
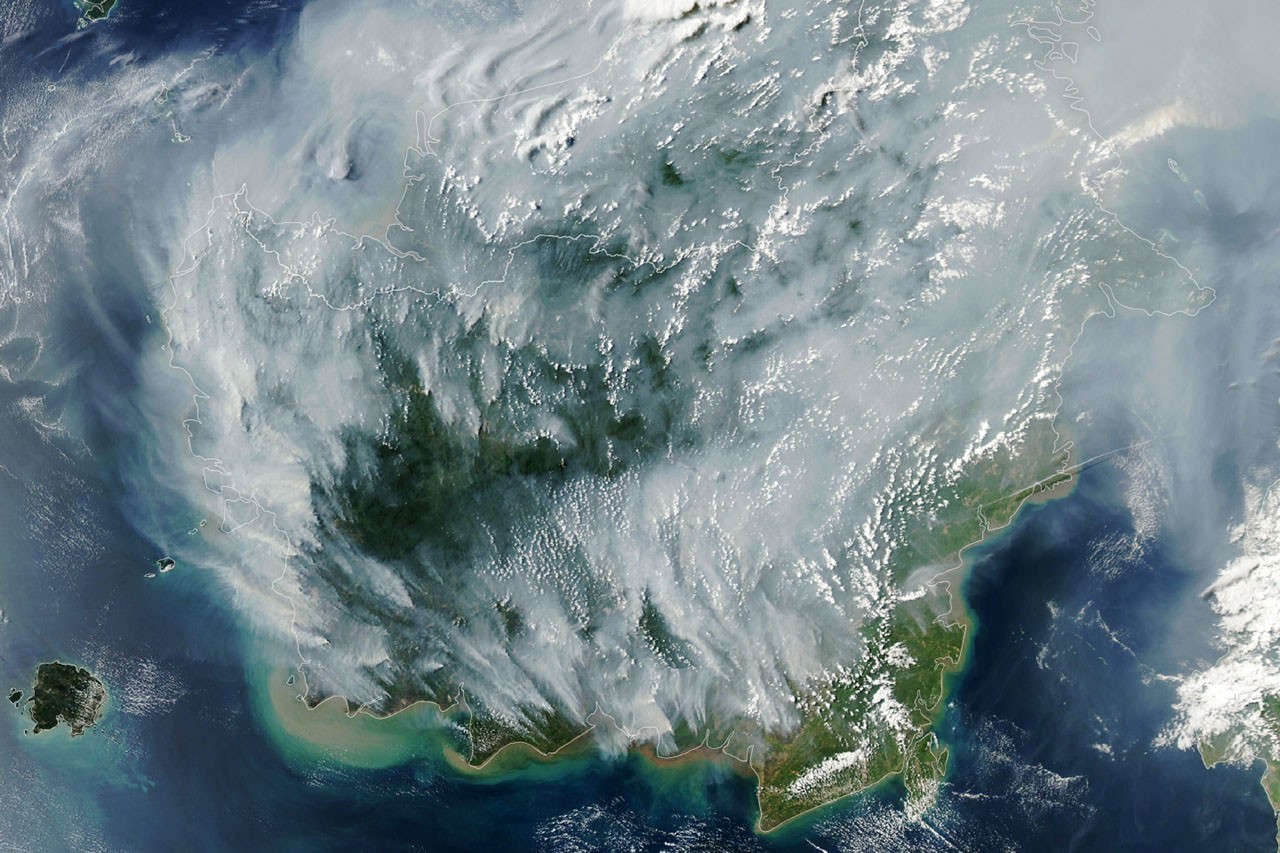
The 2015 season is the benchmark everyone uses. It earned that status by releasing 1.75 billion tons of greenhouse gas equivalents over more than three months, more than Japan emits in a year, according to NASA [7]. A tenth of that is about 175 million tons [9]. Spread across the roughly 30 days the 2026 fires had burned by September 2, that comes to near 5.8 million tons a day, against about 19 million tons a day if you divide the 2015 total by 92 days [10]. The 2015 daily average is really an upper bound, because the season ran past three months, so the current pace sits somewhere above 30 percent of it. What Robert Field of Columbia University is pointing at is the upward slope of the daily numbers, not the cumulative level, and the slope is the part that matters while the fuel is still drying [6].
The pollution ratio is where the health cost gets set early. By one estimate, peat yields three times the fine particulate matter of other tropical forest fires, five times the sulfur dioxide, three times the organic carbon, and twice the methane and carbon monoxide [1]. That figure describes composition, and turning it into dose still depends on wind, on which islands burn, and on how long the smoke sits, none of which lives in an emission factor. What the ratio does establish is that a hectare of smoldering peat is a worse public-health event than a hectare of surface forest fire, and that is a property of the fuel rather than of the response.
Mark Cochrane, an ecologist at the University of Maryland Center for Environmental Science who has done field research on Indonesian peat for nearly a decade, traces today's flammability to canals dug in the 1990s to drain peat swamps for massive rice farms, which significantly lowered the water table across wetland areas; oil palm and other plantation forestry are common in the same landscapes [16]. Indonesia holds about 36 percent of the world's tropical peatlands [3]. Kalimantan, Sumatra and Papua are normally too wet for fire to travel underground, and dry conditions remove that protection [20]. Peat fires smolder at low temperatures, burn beneath the surface, and are notoriously hard to put out [4]. Field's read on what follows is blunt: once fires get underground, they keep burning until the rains come in October or November [12].
That is also the part the satellite record sees least well. Detections from MODIS and VIIRS thin out under thick smoke and cloud, in the forest understory, and below ground, and the recorded fire count can actually decrease when Indonesian fires are most intense [14]. Cochrane's phrasing is that the worst smoke events are paradoxically the hardest to observe from space with those sensors [15]. A ministry hotspot tally therefore sets a floor on activity, since it can only register what the satellites manage to see.
The forecast that the evidence supports is narrow. With NOAA assessing El Niño as present and strengthening in August alongside a positive Indian Ocean Dipole, a pairing that typically cuts Indonesian rainfall sharply [5], the open variable is the date the rain returns. The canal damming, wetland restoration and firefighting investment that followed 2015 [17] should register as a shallower slope this time; if the slope tracks 2015 anyway, the restored area was too small to matter at this drought depth.
Ranked by verification strength, evidence, and original report placement.
Tropical peatland fires are slow-burning, highly polluting and notoriously difficult to extinguish because they smolder at low temperatures and often burn underground through expansive peat deposits.
It is difficult for MODIS and VIIRS to detect fires through thick smoke or clouds, within the forest understory, or underground in peat deposits, and when Indonesian fires become most intense the number of fires recorded by those sensors can actually decrease.
Mark Cochrane, an ecologist at the University of Maryland Center for Environmental Science who has conducted field research on Indonesian peat fires for nearly a decade, said the worst smoke events can paradoxically be the hardest to observe from space with MODIS and VIIRS.
After the 2015 fire season, governments and other organizations have worked to dam up some irrigation canals and restore wetlands, and there have been renewed efforts to improve firefighting capacity and reduce accidental ignitions.
Normally it is too wet for fires to spread through underground peat deposits in Kalimantan, Sumatra and Papua, but they can in dry conditions.
By one estimate, peat fires generate three times more fine particulate matter than other tropical forest fires, five times more sulfur dioxide, three times more organic carbon, and two times more methane and carbon monoxide.
Distinct publishers with included, body-backed reporting in this cluster.
1 article · September 2, 2026
Follow any of these and your For You feed starts watching them — no settings page required.
science
Kalimantan's fires: El Nino is the multiplier, the drained peat is the base rate1 distinct publisher
science
A record-low snowpack, then a drought emergency: Tacoma Power runs its dams on satellite forecasts1 distinct publisher
leadership
In Hawaii, "landfall" is a record-book test, not a preparation trigger1 distinct publisher
science
An AI screen recovered oyster mutations that earlier analysis had overlooked1 distinct publisher
Evidence-backed comparisons of source perspectives and observed adoption signals. Read the methodology
Which Builder, Operator, and Investor concerns the observed source mix emphasized—not a truth score.
Evidence, demonstrated adoption, hype gap, incentives, and confidence are assessed independently, each on its own current evidence. How these are measured.
One publisher, one named count
Two numbers carry this story — 946 hotspots on August 31 and "roughly 10 percent" of 2015's emissions — and only the first arrives with an owner, Indonesia's Ministry of Forestry through SiPongi. The rainfall figure traces to BMKG's own August bulletin, which is listed. The emissions comparison in the headline has no dataset attached, the pollutant multiples are credited to an unnamed "one estimate", and NASA's Earth Observatory is the only publisher carrying any of it.
Monitoring live, restoration unquantified
The monitoring side is plainly operational rather than aspirational: Indonesia runs daily hotspot tallies off American sensors, and the smoke has already closed nine national parks, delayed flights and pushed schools onto remote learning. The remediation side is where measurement stops. "Some" canals dammed, wetlands restored, firefighting capacity improved — no hectares, no budgets, no locations. A stress test needs a baseline, and this reporting does not supply one.
Two errors, opposite directions
Read "a tenth of 2015 in one month" as a pace comparison and you overstate the season: the implied daily average is closer to 30 percent of 2015's than to parity. But the sensors generating the counts go partly blind under the heaviest smoke, so the fire tallies understate the worst days. The two distortions push against each other, and NASA flags both rather than either, which leaves the net barely above aligned.
Own instruments, own limitations
NASA's Earth Observatory is reporting on fires seen through NASA hardware, and the closing passages read like a walk through the catalogue: Worldview, FIRMS, HLS, GFED, plus a partner team's forthcoming Landsat and Sentinel-2 algorithm. Cutting the other way, the piece devotes several sentences to how poorly its own sensors perform in thick smoke, which promotional writing does not do. The researchers quoted also have a straightforward stake in Cochrane's plea for "sustained focus" between El Niño years.
Firm counts, rounded magnitudes
Where NASA reports instrument output — the September 1 image, the hotspot tally, the drought bulletin — this is about as solid as environmental reporting gets. Where it reports magnitude it rounds: "about a month", "roughly 10 percent", "one estimate". Any per-day rate assembled from those is arithmetic rather than measurement, and none of it has a second read.