Science1 publisher2 min readPublished
CSIRO is calibrating drone LiDAR against grass cut and weighed by hand at Boorowa
A CSIRO team flies LiDAR over trial plots at Boorowa, then cuts and weighs the same square meters by hand. Eight months in, the published account describes promising results.
The Scientist · Science desk
What happened
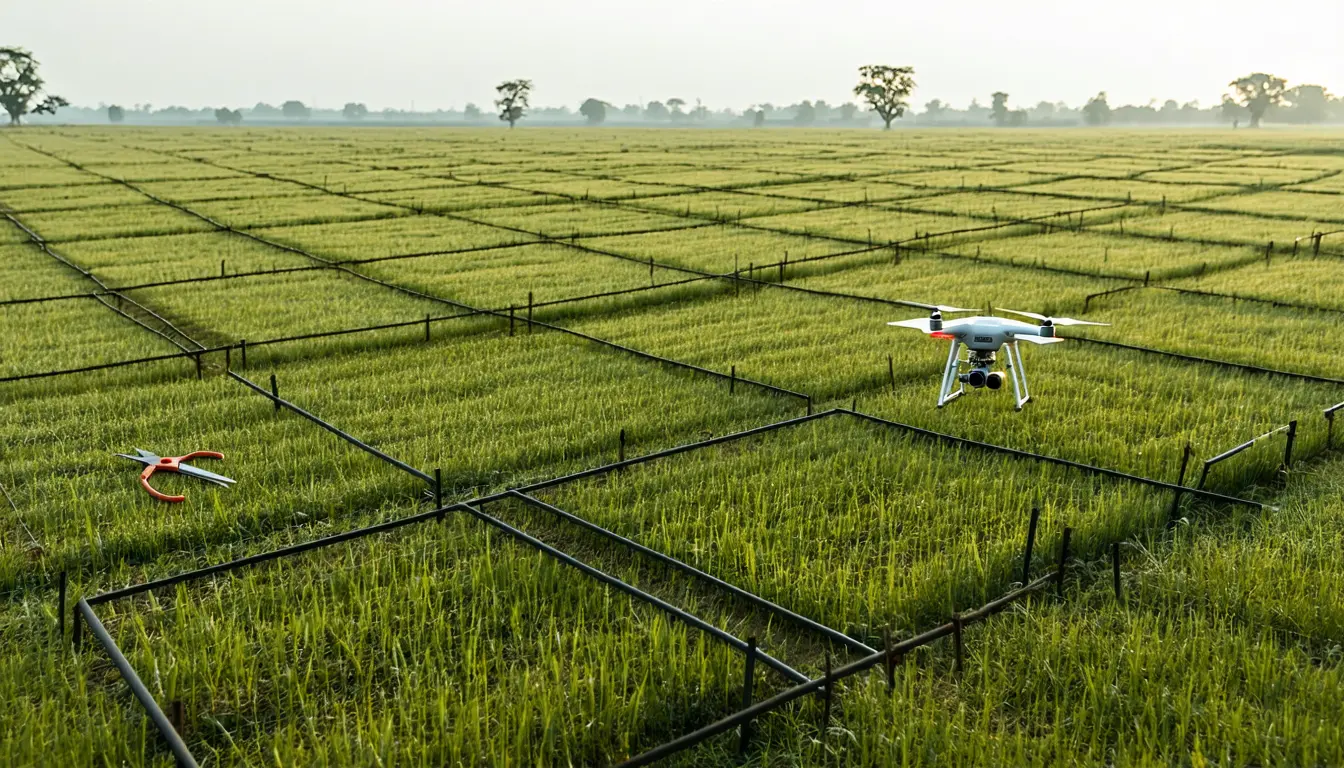
- At CSIRO's Boorowa Agricultural Research Station a drone-mounted LiDAR maps a paddock in three dimensions, and the field team then returns to the same ground with shears and scales to cut and weigh it.
- Meat & Livestock Australia asked CSIRO to apply its LiDAR work to pasture after producers said they wanted satellite reach with plate-meter precision, and the joint proof of concept began in January 2026.
- The team slashes and grazes its trial plots deliberately to produce a spread of biomass levels for the sensor to be tested against.
Compiled by The ScientistSomething wrong?How this is made
Why it matters
- constraint Every number this system produces is height and density above an inferred ground surface, so the accuracy ceiling is set by ground detection.
- cost Validation costs the same labor the tool is meant to remove: someone kneeling in the paddock with shears and scales, one square meter at a time, for every reference point in the dataset.
- decision The plate meter still holds the only published accuracy claim of the two, so a grazier's stocking and paddock-rotation decisions stay where they are for now.
- capability A working version would put plant height and canopy porosity into a whole-paddock estimate. Edwards said satellite NDVI lacks height and saturates once the canopy gets dense.
LiDAR fires hundreds of laser pulses a second and times how long each one takes to come back [12]. The usual product is a point cloud, a record of where each pulse stopped. A ray cloud keeps the full path the pulse traveled as well, so the empty space it passed through is also data, and the file becomes a measure of how porous or solid a volume is [14]. Edwards' team built that approach with Wine Australia to measure canopy structure in vineyards, using a set of tools called RayCloudTools from CSIRO's Technology research unit [13].
Grapevines sit above a gap. The ground is a surface you can find, and everything above it is canopy [16]. Grass gives you nothing like that, because it grows from the soil up, and CSIRO calls separating plant from ground the hardest technical problem in the whole system [16]. A biomass estimate is built from what stands above the inferred ground surface, so an error in that surface passes into the estimate, and it costs most where the grass is shortest. "Ground detection is a huge challenge for this project," Kikuchi said [4].
"Graziers need to know the exact amount of living pasture biomass," Kikuchi said [3]. His field team flies the plots, then walks back into the same paddock with shears and scales and cuts square meter by square meter [2][21]. A cut quadrat is single-use, so each one yields one paired observation. To get a spread of values to fit a curve against, the team slashes and grazes the trial plots on purpose, producing high and low covers on demand [17].
The phys.org account, published in September, describes promising results and does not include an accuracy figure or the number of quadrats cut [15][20]. Eight months separate the project's start from that account [19].
Satellite NDVI, the free end of the range, is derived from how plants reflect and absorb different wavelengths of light [7]. Edwards, who leads CSIRO's Agrisensing Analytics team [5], said of NDVI: "It's considered a reliable indicator of how much live green vegetation is present." He also said that "accuracy drops away in dense canopies, where the index quickly saturates, an issue compounded by the lack of plant height information from satellites" [6]. "We are currently missing a method in between these two ends of the scale," he said [10]. The rising plate meter at the other end is itself a calibration curve built from many hand-cut estimates [8]. Both methods answer to the same reference, and both can be run over the same plots on the same day.
What to watch
- An error figure for the LiDAR estimate against the cut quadrats, reported separately for short and tall swards.
- Whether MLA funds work beyond the proof of concept, and whether the ground detection routine ships with RayCloudTools.
- Tests on pasture species and regions beyond the Boorowa trial plots.