Science1 publisher3 min readPublished
Damaged trees cluster in the poorest, most diverse neighborhoods of 29 US cities
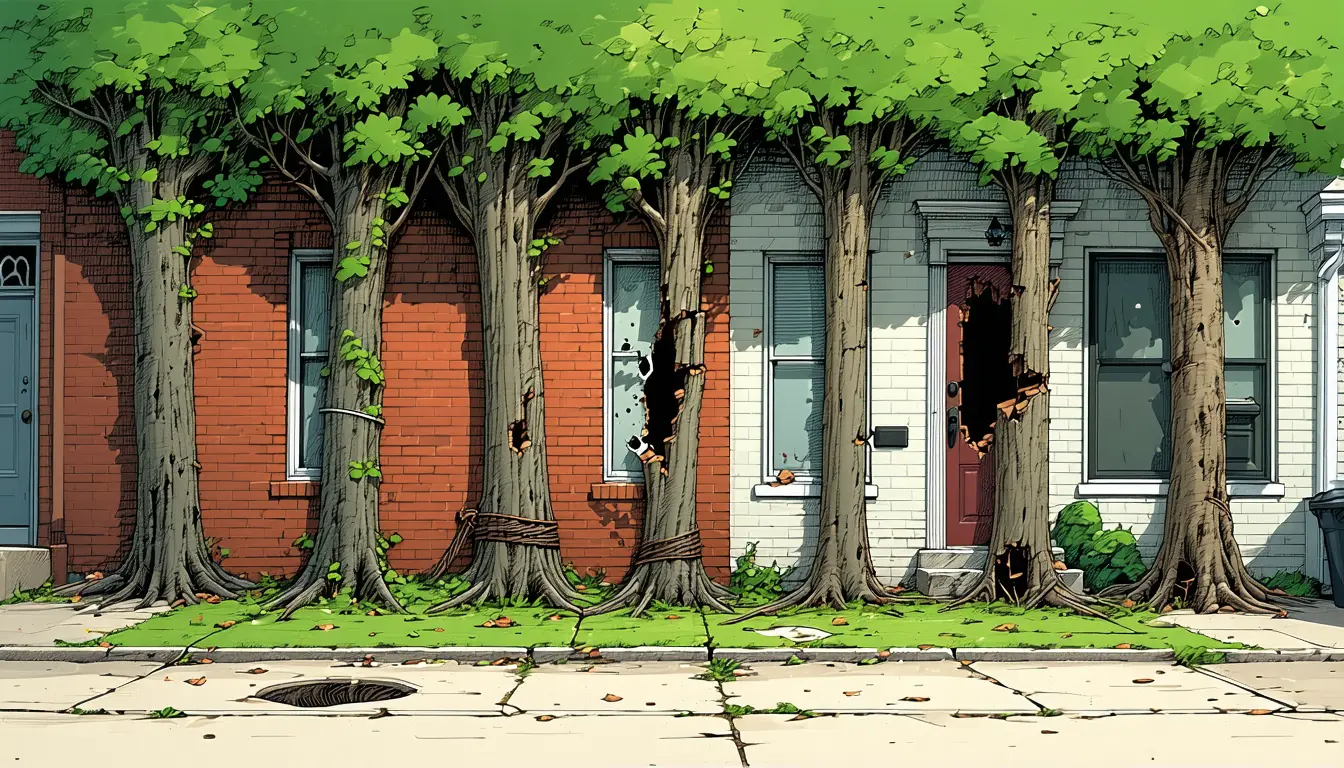
Cornell researchers found nearly 60% of trees damaged in poor, racially diverse areas of 29 US cities, against 17% in the whitest, most affluent ones. Aerial canopy counts cannot see that gap, so they likely overstate the shade poorer residents actually get.
The Scientist · Science desk
What happened
- Trees in minority neighborhoods also had 7% fewer leaves and were more likely to be dead.
- The data were ground assessments of 23,659 trees in 3,166 representative plots from the Urban Forest Inventory & Analysis program, matched to American Community Survey census data.
- The study, published Sept. 17 in Urban Forestry & Urban Greening, began as first author Maya Mangala-Munuma's Cornell honors thesis after she saw trees change across Grand Rapids neighborhoods.
- The study did not examine causes, though senior author Daniel Katz said lower homeownership is likely a big factor because owners have more incentive to plant and care for trees.
Compiled by The ScientistSomething wrong?How this is made
Why it matters
- constraint A city that sets canopy goals from aerial tree counts can meet them in a poor neighborhood where most trees are damaged, so the goal is met without the cooling it was meant to deliver.
- exposure Damaged trees can drop branches or fall whole, so residents of the poorest, most diverse neighborhoods face more physical risk from their street trees on top of getting less shade.
- decision If Katz's homeownership explanation holds, planting programs in rental-heavy neighborhoods would have to fund ongoing care, because the owners' incentive to look after trees is what those areas have less of.
Earlier work on urban tree inequality came from aerial images, and it showed that lower-income, minority neighborhoods have fewer trees [5]. An image from above shows where a crown is. It shows much less about whether the tree under it is sound. "If you're just looking top-down at how many trees there are, you're going to miss the fact that these trees are also going to perform differently based on how damaged they are," Mangala-Munuma said [8]. The Cornell account describes this as the first study to account for the health of those trees [5].
The unit of measurement is the plot. The 23,659 trees work out to about 7.5 per plot [3], and the 3,166 plots to about 109 per city on average [4]. The headline comparison sits at the two ends of the range: the whitest and most affluent neighborhoods against the poorest and most diverse [2]. The published summary does not define "damaged" or say where the income and race cut-offs fall, so it is unclear how many plots sit in each end group.
The gap is large. Nearly 60% against 17% is about three and a half times the damage rate [1]. Put the other way, roughly four in ten trees in the poorest, most diverse neighborhoods were undamaged, against 83% in the whitest, most affluent ones [2]. Those healthy shares apply to neighborhoods that the aerial studies had already found had fewer trees [5]. Both deficits point the same way, so the difference in sound trees per street is wider than either one shows alone.
The step from damage to lost benefit is an inference. The measurements described are of the trees themselves: damage, leaf cover, death [2][3]. The benefit side comes from what trees are known to do. A healthy, mature tree cools, shades, reduces air pollutants and catches stormwater, and a damaged one does those jobs less well or not at all [6]. Katz, the senior author, chose his verb carefully. "What this work implies is that people who are most vulnerable and most need these services are the least likely to receive them," he said [7]. Earlier research tied a lack of trees and their services to tens of thousands of doctor's visits and hundreds of deaths [13].
I think the conclusion that tree counts overstate what poorer residents receive holds, at least in direction. Putting a size on the shortfall, in degrees of cooling or gallons of stormwater, needs a direct measurement of those services.
Katz also pointed to housing history. "Even though the practices of redlining haven't been in operation for many decades, those legacies persist," he said [10]. That is his explanation; the study did not test it. Matching tree plots to census figures can show where damage concentrates. It cannot say which neighborhood difference produces it.
What to watch
- Katz's lab is using satellite data to map the health of individual trees; a tree-by-tree record would test whether the plot-based pattern holds street by street.
- Direct measurements of temperature or stormwater under damaged and healthy canopy in these neighborhoods would put a size on the benefit shortfall the study infers.
- Whether city parks and recreation departments start tracking tree condition alongside tree counts when they set targets for low-income neighborhoods.