Science1 distinct publisher2 min readPublished
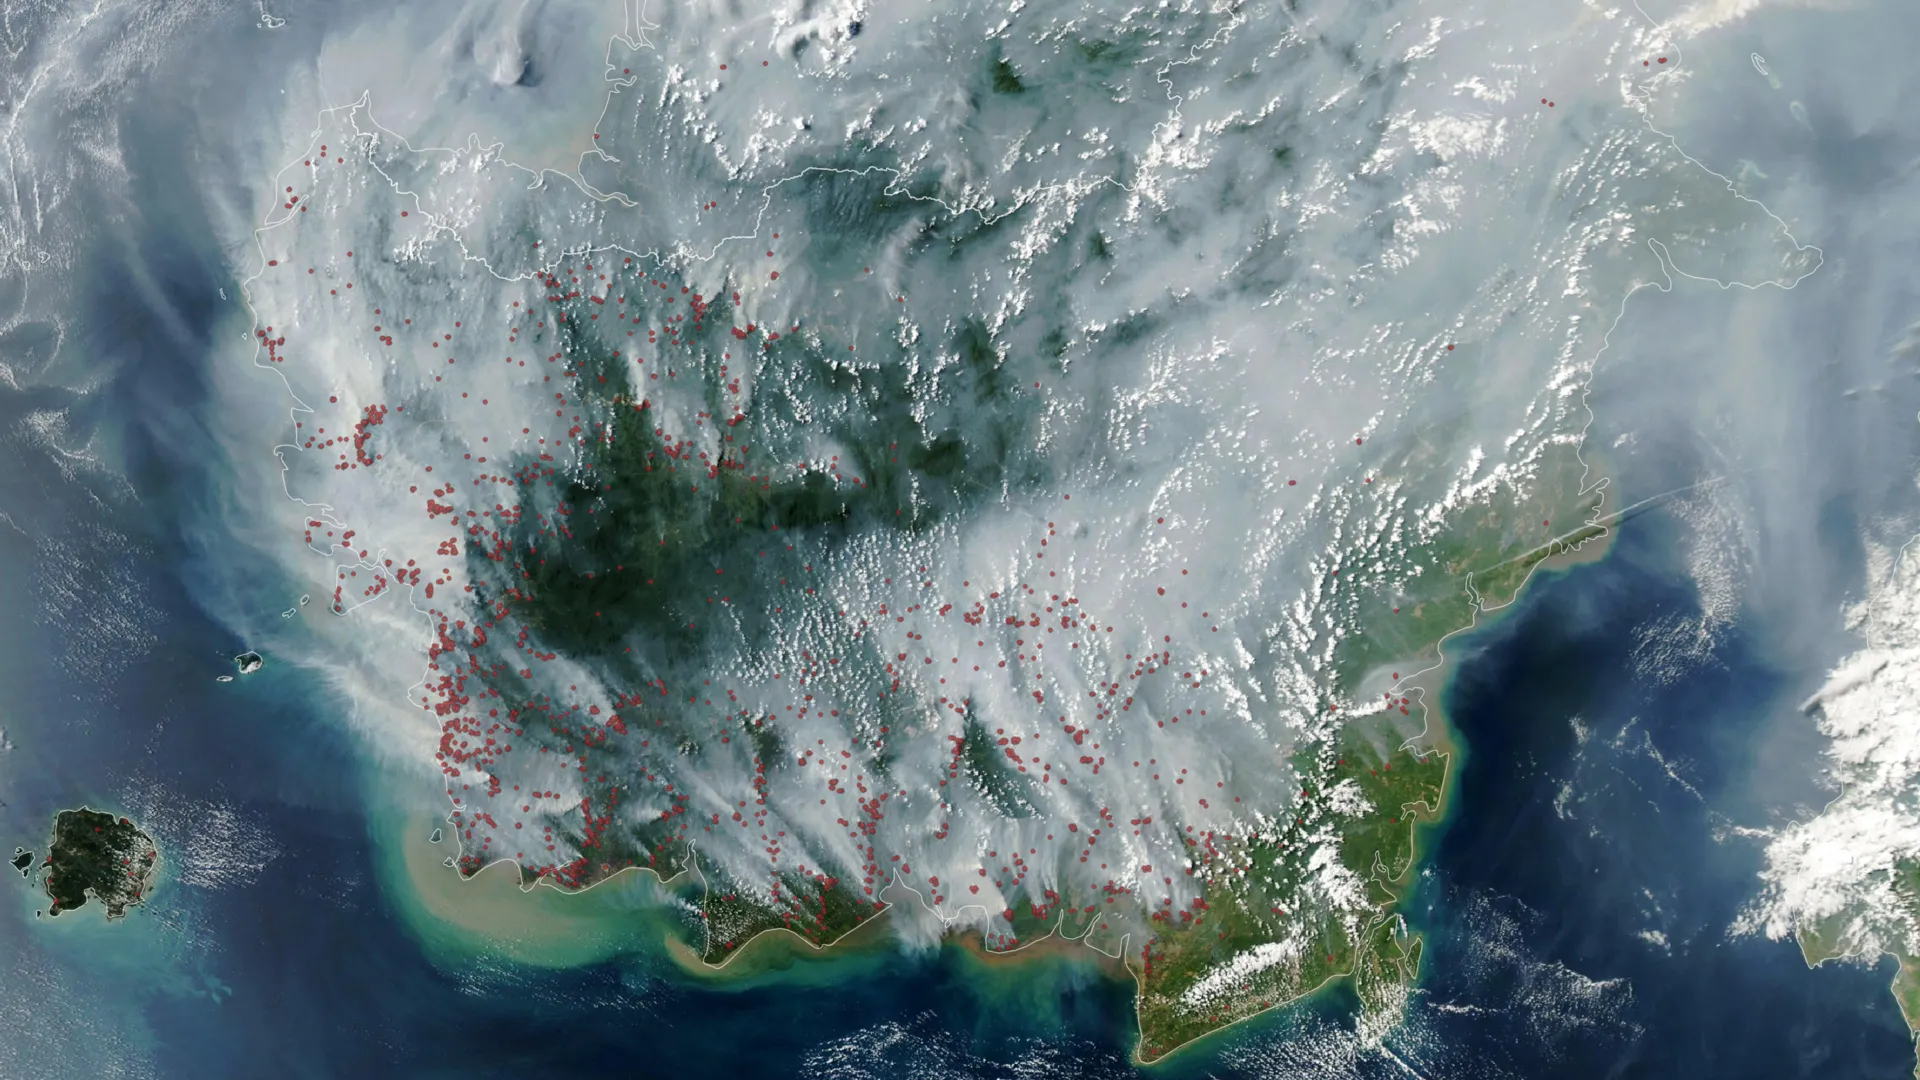
NASA Earth Observatory puts the 2026 Indonesian fire season at roughly a tenth of 2015's 1.75 billion tons of greenhouse gas equivalents after about a month, with the underground smoldering fires the hardest for satellites to count.
The Scientist · Science desk

science
Indonesia's peat fires logged a tenth of 2015's emissions in their first month1 distinct publisher
science
Extreme drought spread across 44% of Puerto Rico during a rainy season that stayed dry1 distinct publisher
science
A record-low snowpack, then a drought emergency: Tacoma Power runs its dams on satellite forecasts1 distinct publisher
science
NOAA separates California's marine heat wave from an El Niño still months offshore1 distinct publisher
Compiled by The ScientistSomething wrong?How this is made
Ten percent of 1.75 billion tons is about 175 million tons of greenhouse gas equivalents, released in roughly the first month of burning [19][13]. In 2015, more than three months of fire produced the full 1.75 billion tons [12], an average below 580 million tons a month [20], which puts month one of 2026 near 30 percent of that pace [21]. The monthly average is an arithmetic construction rather than a measurement: 1.75 billion tons is a season total, and Robert Field of Columbia University, who built the Global Fire Weather Database, is comparing the shape of the activity curve, which he describes as tracking sharply upward and similar to 2015 [10]. Neither number describes how much dried peat sits below the surface waiting to carry the smolder.
The pollutant argument rests on a set of ratios. By one estimate, peat fires produce three times the fine particulate matter of other tropical forest fires, five times the sulfur dioxide, three times the organic carbon, and twice the methane and carbon monoxide [3]. The NASA account introduces those figures as one estimate and names neither the study nor the unit of comparison [22]. A multiplier with no denominator, per hectare burned or per ton of fuel consumed, cannot be turned into an expected concentration for any particular city downwind.
Counting has the same problem in a different form. SiPongi, the Ministry of Forestry platform built on MODIS and VIIRS data, logged 946 hotspots on August 31 [17], and NASA's own description of its imagery notes that a single fire can register as several detections [5]. The number is a count of detections, not a census of fires. Both instruments also struggle to see fires hidden under thick smoke or cloud [18], and Indonesia's near-real-time picture leans on those sensors [23]. The useful part is that the error has a known direction: as the smoke thickens, the counter reads low.
This material offers no measurement of anyone's exposure: no air-quality readings, no health outcomes, no flight data appear in it. The historical statement is qualitative, that drought-driven fires over three decades have covered large areas in smoke for weeks and disrupted the lives of millions [7]. What is specific is the mechanism that ends it. Under normal conditions the peat in Kalimantan, Sumatra and Papua is too wet for fire to travel underground, and drought is what opens it [15]; Field's view is that once fire is in the peat it will not stop until the rains arrive in October or November [16]. Rainfall, not firefighting, determines the length of this exposure window.
Ranked by verification strength, evidence, and original report placement.
Tropical peat fires smolder through dried wetland soils and large peat deposits, often continuing underground at relatively low temperatures, which makes them extremely difficult to extinguish.
Over the past three decades, severe drought conditions in Indonesia have repeatedly produced long-lasting fires that blanket large areas in smoke for weeks and disrupt the lives of millions of people.
Some of Indonesia's most destructive fire seasons in recent decades came during El Nino, particularly 1997 and 2015.
Under normal conditions the peat deposits in Kalimantan, Sumatra and Papua are too wet for fire to move underground, and drought allows flames to enter the peat and continue smoldering below the surface.
MODIS and VIIRS can struggle to detect fires hidden by thick smoke or clouds.
A NASA Earth Observatory account published September 6, 2026 reported that Indonesia's peat fires are surging early in the 2026 fire season as a strengthening El Nino and severe drought dry out wetlands that can burn underground for months.
Distinct publishers with included, body-backed reporting in this cluster.
1 article · September 6, 2026
Follow any of these and your For You feed starts watching them — no settings page required.
Evidence-backed comparisons of source perspectives and observed adoption signals. Read the methodology
Which Builder, Operator, and Investor concerns the observed source mix emphasized—not a truth score.
Evidence, demonstrated adoption, hype gap, incentives, and confidence are assessed independently, each on its own current evidence. How these are measured.
Primary observer, single voice
The observational spine is genuinely strong: a dated MODIS image from Aqua, NOAA's August El Niño assessment, national meteorological data on the August rainfall deficit, a government hotspot count and three named researchers with Indonesian peat experience. The paperwork behind the two most quotable numbers is missing. Neither the 1.75 billion ton 2015 total nor the 'roughly 10 percent' figure for 2026 names the emissions inventory that produced it, and the pollutant multipliers come with a hedge instead of a citation.
Monitoring operational, forecasting still experimental
What is actually deployed here is the measurement chain. Indonesia's forestry ministry runs SiPongi on NASA and NOAA feeds and published a hotspot count for August 31, and the September 1 Aqua image shows the same pipeline in routine use. The predictive layer is thinner: Field's Global Fire Weather Database is described as experimental, and the restoration and firefighting measures built after 2015 are presented as untried this season.
Framing tilts high, the sensors tilt low
A tenth of 2015 in one month reads as acceleration, and the arithmetic points the other way: 2015 averaged under 580 million tons a month across more than three months, so 2026's opening month, near 175 million tons, is running at roughly a third of that pace. Pushing back the other direction, the same account says its counts are biased low because the heaviest smoke blinds the instruments. The two distortions do not cancel, and both are modest enough that Field's 'three weeks in and tracking sharply upward' is the fair reading of the season so far.
Agency describing its own instruments
NASA Earth Observatory wrote this about fires seen by NASA satellites, and ScienceDaily reproduces it with the source line attached rather than reporting against it. The researchers quoted sit in the same orbit: Field built the fire weather database credited here, the student calling 2026 a stress test works with a NASA-linked team, and Cochrane's decade of Indonesian fieldwork is the basis of the detection caveat he raises. That does not make the numbers wrong, but it does mean the sceptical read on the satellite record comes from the people who maintain it, with no commercial or political counterparty heard at all.
Physics solid, accounting unaudited
The mechanism and the conditions hold up well. Peat carries fire underground once water tables drop, El Niño was strengthening on NOAA's August assessment, and the national weather service recorded almost no rain across most of the country in early August, with three separate measurement systems converging inside one account. Confidence falls on the quantities, which rest on rounded shares of an unattributed inventory and cannot be checked against a second reading.