Science1 publisher2 min readPublished
Adriatic reconstruction clocks prehistoric sea-level rise at up to 25 millimetres a year
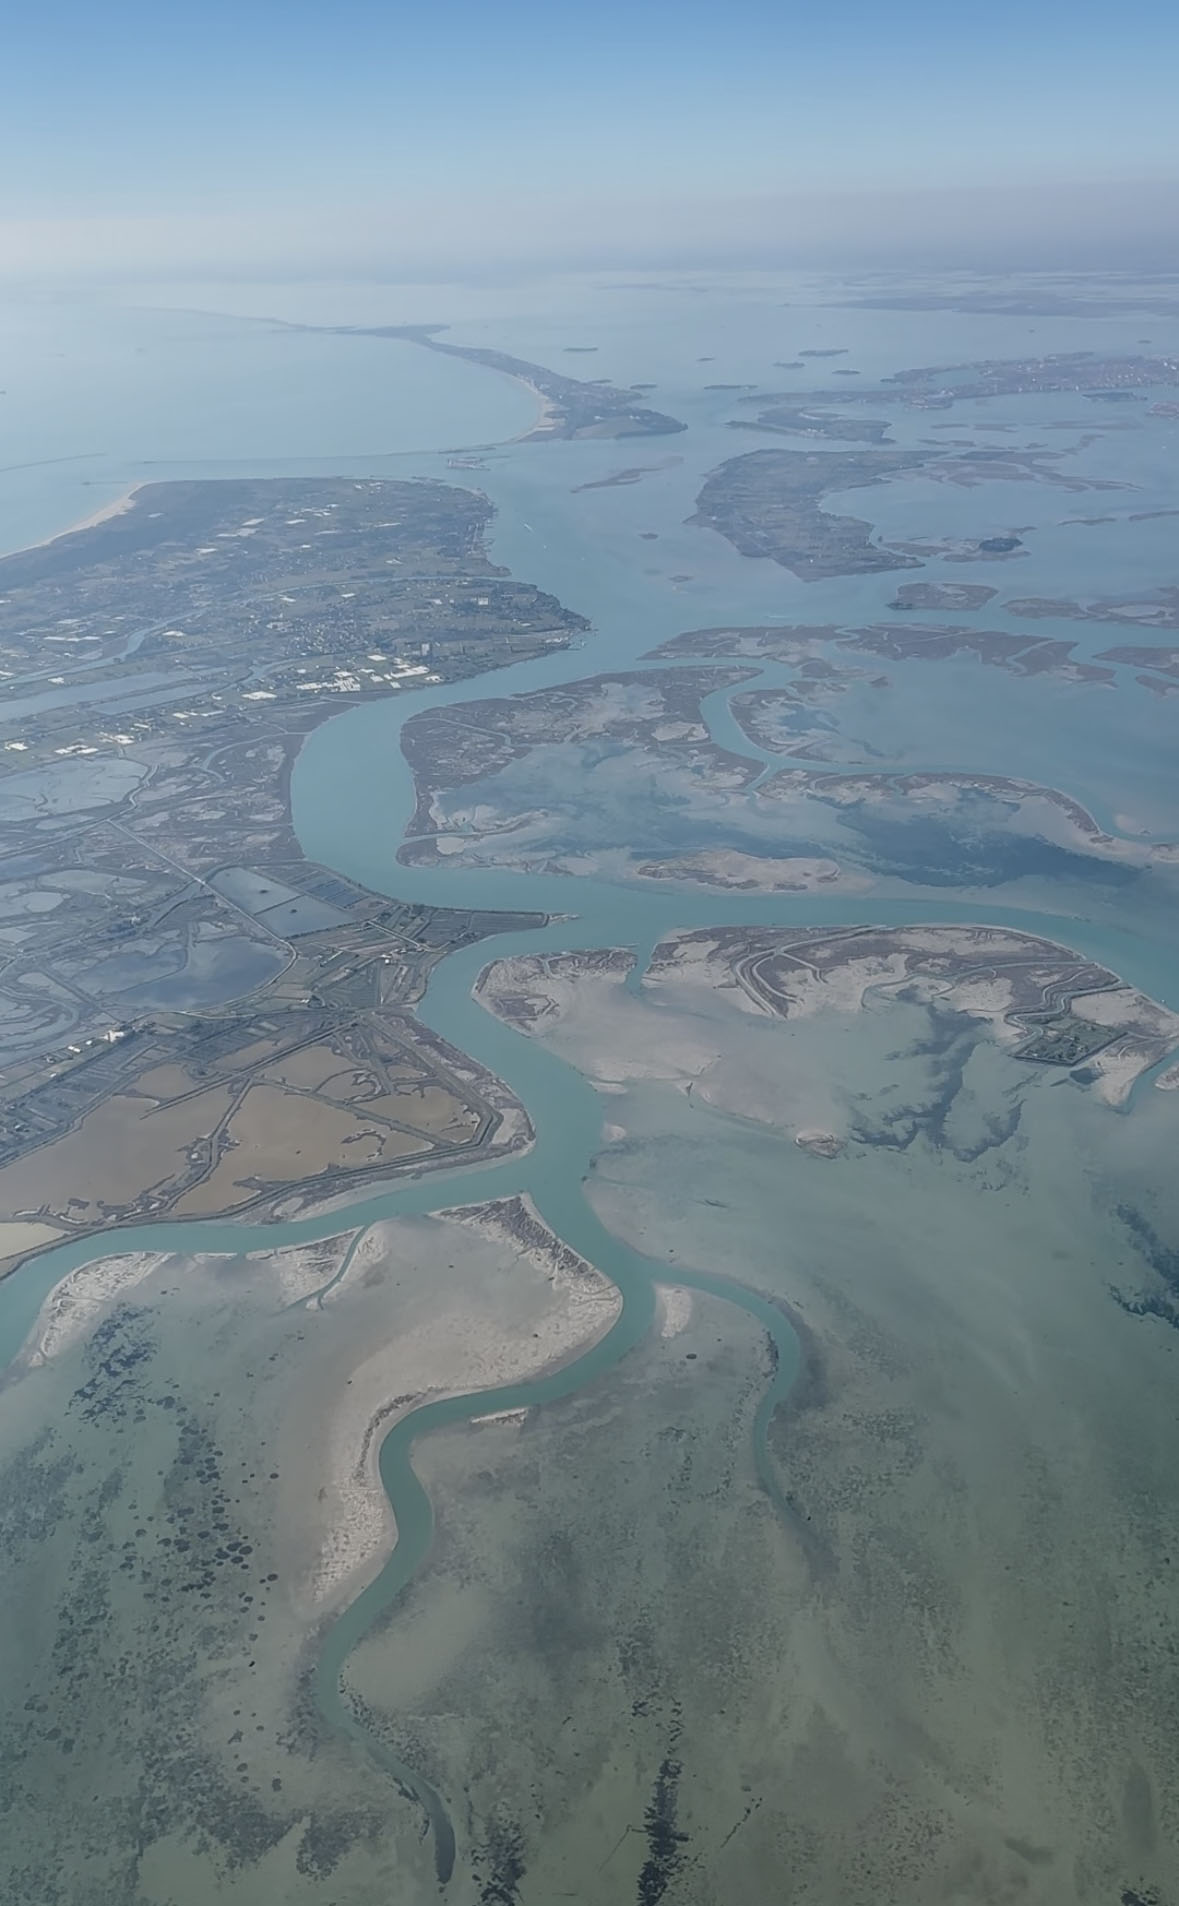
Southampton and OGS have mapped 5,000 years of drowned coastline in the northern Adriatic from sediment cores and new geophysical data. The fastest published rate is a peak inside a much slower millennial average.
The Scientist · Science desk
What happened
- A study led by the University of Southampton and Italy's National Institute of Oceanography and Applied Geophysics reconstructs how the northern Adriatic landscape evolved between 9,000 and 4,000 B.C.
- Sea level rose in staggered steps that at times reached 25 millimetres a year, submerging plains and turning them into wetlands and lagoons as the water pushed inland.
- One of the documented stages is a rapid rise around 8,400 B.C. that created tidal channels, marshes, sandbanks and large lagoons, after which conditions were more stable for a time.
- Ground that is now the Venice Lagoon was dry land kilometres from the sea, the lagoon towns farther east such as Grado sat inland, and Trieste would have been hills above swamps.
Compiled by The ScientistSomething wrong?How this is made
Why it matters
- constraint A peak rate only becomes a planning input once the window it was averaged over is stated; without that, the northern Adriatic figures cannot be lined up against a twenty-first-century trend.
- capability Legacy cores read together with high-resolution seabed geophysics let archaeologists decide where offshore to spend ship time before anyone dives or drills.
- precedent Paleogeographic reconstruction becomes the expected groundwork for prehistory on other drowned shelves, where much of the habitation record lies below water.
Eight metres of rise in 1,200 years works out at about 6.7 millimetres a year [6][1]. Those 1,200 years, ending at 6,600 B.C., are the one stretch of the published account with both a height and a span attached, and the 25 millimetres a year quoted for the fastest phases is a peak inside a staggered sequence, nearly four times that millennial average [2][2]. The later rise of up to five metres after 6,000 B.C. is given as a height alone [7].
How much land went under followed from the shape of the ground as much as from the water. Samuele Ongaro, the lead author and a PhD researcher at Southampton, said "the flat nature of the landscape also made it prone to significant land loss. Communities were forced to adapt over time, choosing where to hunt, fish and settle" [12][15]. On a plain that flat, a modest vertical rise moves the shoreline a long way: the reconstruction has the sea creating, subsuming and recreating lagoons and marshes kilometres further inland [6].
The method is how those steps were found. The team combined existing sediment-core analyses with new high-resolution geophysical data from OGS, identified the different sediment types and modelled successive flooding events, which let them follow coastal barriers and the marshy back-barrier systems behind them shifting landward [9]. That design assumes a sequence of flooding events, and that is the record it recovered: after 5,800 B.C. the lagoons and landscape of today begin to take shape [8]. The paper is in Quaternary Science Reviews [3].
The announcement of the work does not compare any of these rates with present-day sea-level rise or with coastal adaptation planning [20]. The stated purpose is archaeological. Federica Donda, a marine geologist in the geophysics section of OGS and a co-author, said: "A significant portion of the areas frequented by ancient populations is now underwater, and their history and evolution cannot be understood through terrestrial archaeology alone" [13][16].
The part of this other researchers can reuse is the terrain: a gentle gradient, high sediment supply, and coastal features that the same rise built and then destroyed. The team hopes further study will show how communities shifted their activities in response to coastal flooding, and how that eventually affected the advent of farming in the region by Neolithic people [19].
What to watch
- Whether the Quaternary Science Reviews paper gives dating uncertainty and an averaging window for the 25 mm per year peak. The announcement gives neither.