Science1 publisher2 min readPublished
Delhi's grid now loses 5 to 6 percent of its electricity, down from more than half in 2002
Delhi cut grid losses from over 50 percent in 2002 to 5 to 6 percent in 2026, according to a power-systems professor at Jamia Millia Islamia. The professor offers Delhi as a model for high-loss grids in 11 countries, with the steps that produced the result set out after the figures.
The Scientist · Science desk
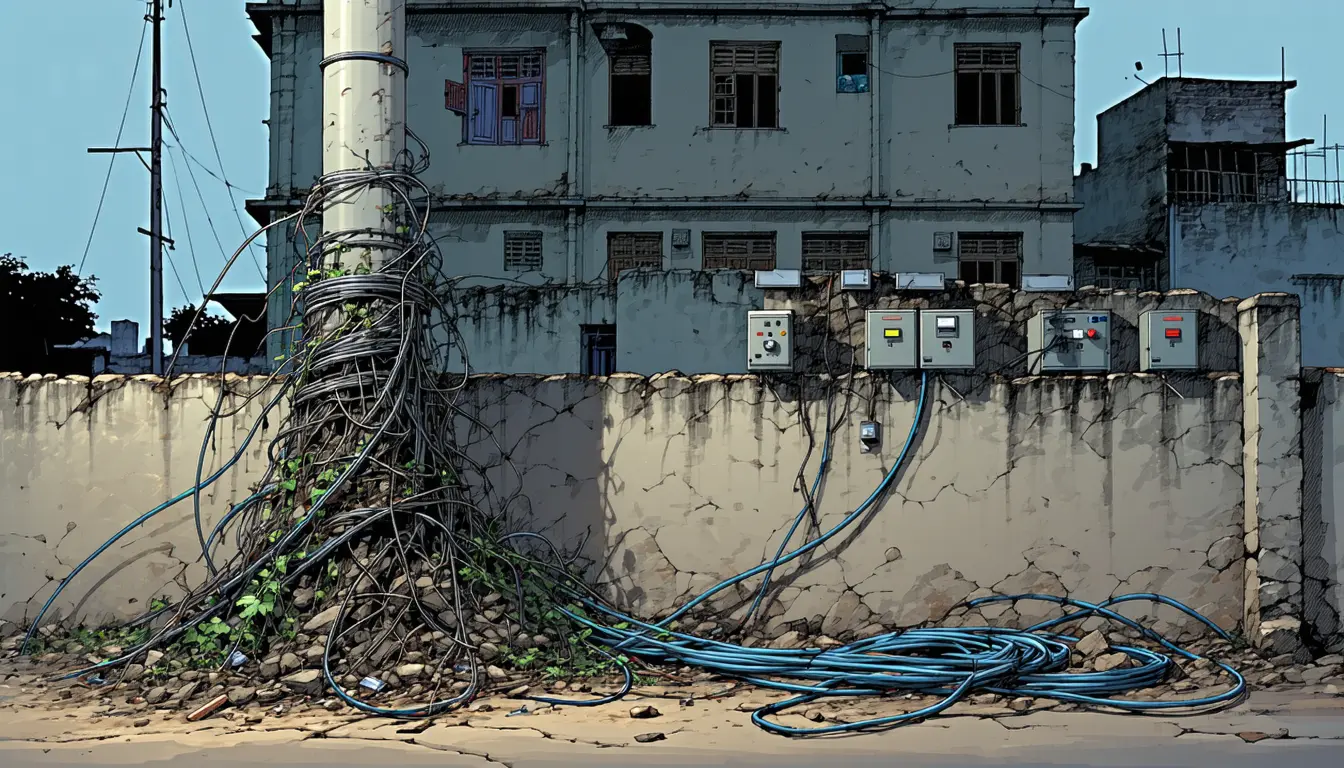
What happened
- Delhi's grid reliability index rose from around 70 percent in 2002 to above 99.9 percent, by the author's figures.
- The author blames the earlier decline, which worsened through the 1980s and 1990s, on an aging grid lacking key technologies and on utilities with little accountability.
- Delhi buys 76 percent of its electricity from central generators and private suppliers in neighbouring states, and in-city generation is limited to gas and renewables.
- Peak demand in the city of about 23 million people reached an all-time high of 8,748 megawatts this year.
Compiled by The ScientistSomething wrong?How this is made
Why it matters
- cost With three-quarters of supply bought from outside the city, every unit lost to theft or old equipment is power the utilities have already paid for and cannot bill.
- constraint Because the headline loss rate folds theft in with worn equipment, a utility copying Delhi cannot tell from it whether to spend first on meters and enforcement or on lines and transformers.
- constraint Delhi's match with France and Belgium is like for like only if those countries count theft in their loss figures the way Delhi does.
The loss figure combines two problems. The author, who teaches power systems and smart grids [6], writes that the city was losing more than half of its power "through obsolete equipment and theft" [2]. Delhi took 24 years to bring that combined figure from above 50 percent to 5 or 6 percent [2].
For the utilities' accounts, the change is close to a doubling. A distributor losing more than half its power is paid for less than half of it. One losing 5 to 6 percent is paid for about 94 to 95 percent [1]. The author links the old losses directly to the lack of investment. Utilities "got paid for only a fraction of the electricity they were trying to deliver," the author wrote, and the lack of funds kept them from investing in better grid infrastructure [3].
The reliability index needs a definition before it can be turned into hours. The author calls it "a measure of how often electricity can be counted on" [4]. Read as the share of hours with supply, the 2002 figure of about 70 percent means roughly 7.2 hours a day without power, and the current figure above 99.9 percent means under nine hours a year [3]. That conversion holds only if the index is time-based.
The evidence for the turnaround is two endpoints from one city [1]. The author credits "a remarkable effort by the government and the city's distribution utilities" over the last quarter century [7]. A before-and-after record with no comparison grid can establish that losses fell. Tying the fall to particular actions takes a record of what was done and in what order.
The model claim is the author's own. Grids in 11 countries [4], among them Kenya, Pakistan and Brazil, are losing heavily and look like Delhi's did 25 years ago, the author writes [9]. "I believe it's possible to improve electricity in these places by adapting the changes Delhi made," the author wrote [10]. I think the two endpoints are good evidence that a distribution grid losing half its power can recover in about a generation [2]. The account promises "an inside look at how the city accomplished it" [13], and its opening moves on to the grid's size and energy mix before describing any of those changes or splitting the old losses between equipment and theft.
What to watch
- The rest of the author's account, which promises to explain how Delhi's government and utilities made the changes, and whether it splits the fall between theft and equipment losses.
- Whether independently published loss and reliability series for Delhi match the 2002 and 2026 endpoints and state how the reliability index is computed.
- Whether any of the 11 listed countries adopts Delhi's approach and reports before-and-after losses on the same definition.