Invest1 publisher2 min readPublished
Computer equipment outspent US housing by $4 billion in the second quarter
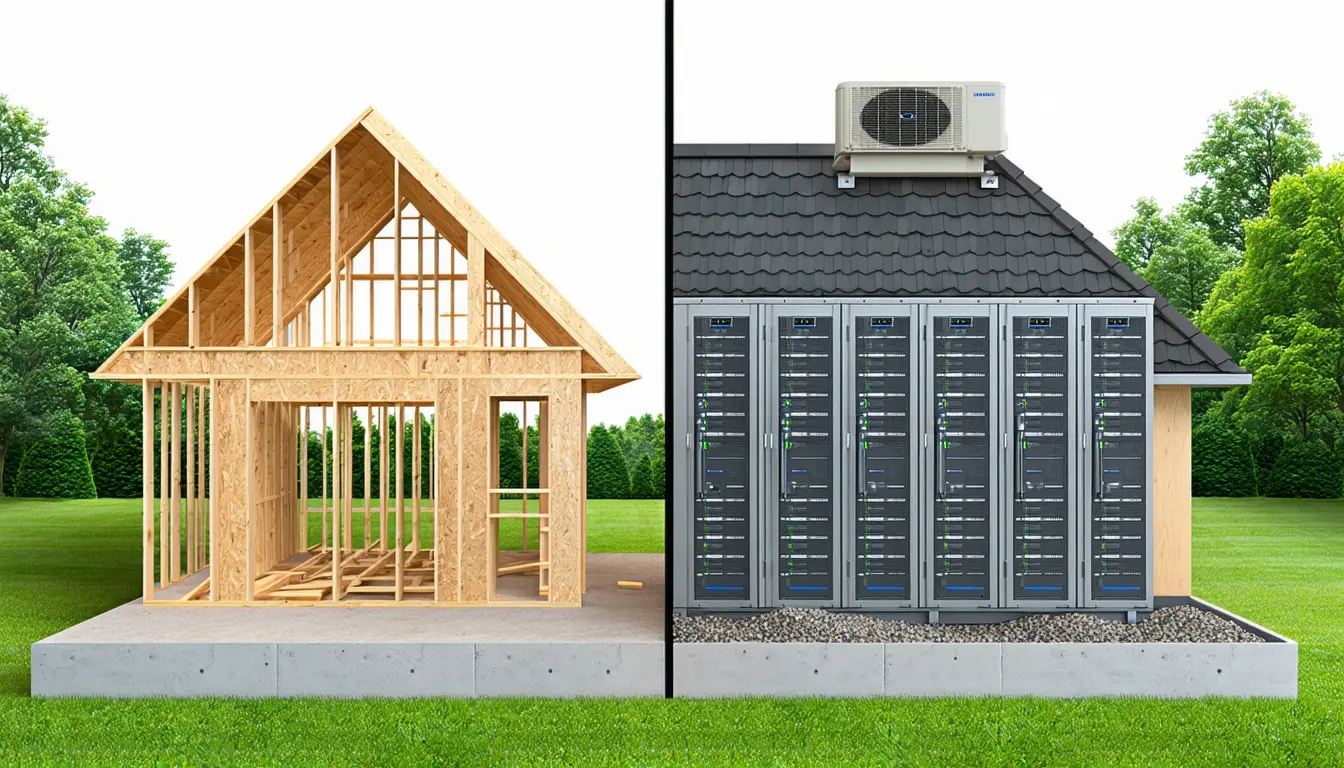
Real spending on information processing equipment reached $752 billion against $748 billion of residential investment. The gap is half a percent, and the six-company capex forecast that supports the concentration argument is a separate series.
The Investor · Invest desk
What happened
- Real US spending on information processing equipment climbed 51% to $752 billion in the second quarter, on Bureau of Economic Analysis data cited by Fortune.
- Real private residential fixed investment was $748 billion in the same quarter, 18% below its early 2021 peak, on the same BEA data.
- The comparison came from Adam Shapiro, a vice president at the San Francisco Fed, who posted it on LinkedIn recently.
- S&P Global estimated last month that capex at Alphabet, Amazon, Microsoft, Meta, Oracle and SpaceX will top $1.3 trillion in 2027, from $470 billion in 2025.
- S&P expects the pattern to turn in 2028, with revenue accelerating and capital expenditure flattening out.
Compiled by The InvestorSomething wrong?How this is made
Why it matters
- constraint A $4 billion lead on a $748 billion base is barely a margin: a single revision, or one quarter of rate-driven housing recovery, restores the old ranking without anything changing in the data centers.
- contradiction The crossover is measured in national accounts; the concentration claim rests on S&P's six-company basket, and at 1.7 times the whole equipment line the 2027 forecast cannot be a subset of it.
- exposure If demand undershoots, the overcapacity S&P flags sits on six identifiable balance sheets, and S&P says their capex is already growing faster than their revenue.
- decision Funding a build that outruns internal cash generation becomes a credit-market decision: SoftBank, outside the six, is exploring more than $11 billion of debt for its OpenAI investment.
Work back through the percentages and the two lines are not mirror images. If $748 billion sits 18% below the early-2021 peak, that peak was about $912 billion, so residential investment has given up roughly $164 billion [1][2]. If $752 billion is 51% above where the equipment line started, it started near $498 billion and has added about $254 billion [2][3]. Computers gained roughly $90 billion more than housing lost [4]. The two moves have separate causes, too: housing has been largely frozen since 2022, when the Federal Reserve began raising rates to bring inflation down [11].
The crossing itself is $4 billion on a base of $748 billion, or about half a percent [1]. A few billion dollars of movement in either series puts residential back in front.
"We're seeing a pivotal shift in the U.S. economy: investment is shifting away from residential investment and towards computers," Shapiro said in his post, and added that "The AI investment boom is massive" [4][5]. His comparison uses national accounts data, and the category is described in Fortune's item as covering data centers and computer hardware [3]. The claim that a handful of companies are driving this comes from elsewhere in the same item: S&P Global's basket of six named firms, one of which is SpaceX [7]. S&P's path takes those six from $470 billion in 2025 to more than $1.3 trillion in 2027, a 2.8-fold increase in two years [7][5]. That 2027 figure is about 1.7 times the entire $752 billion equipment reading [6]. The two series count different spending.
S&P's forecast comes with a caution. The ratings firm said capex is growing faster than revenue and warned the build-out could leave overcapacity if demand does not arrive as expected [8]. It expects revenue to accelerate and capex to flatten in 2028 [9]. Until then it sees cash flow across the six as collectively negative in 2026 and 2027 [10]. Fortune's item uses the term operating cash flow for that measure and does not give S&P's definition.
So the crossover is real and it is thin. The concentration story is a separate question: a national equipment total tells you what was bought, not by whom, and the $1 trillion-a-year figure attributed to a handful of companies is a projection of company capex [12][7]. Both can be true at once, and only the equipment total is measured.
What to watch
- BEA's next estimate of both series: a revision of more than $4 billion in either direction settles which line is larger.
- Whether the six companies' reported full-year capex comes in near S&P's projected $870 billion for 2026.
- How SoftBank's prospective $11 billion-plus bond prices, as a test of credit appetite for AI capex outside the six.