Science1 publisher3 min readPublished
Cambridge's open-source Tessera maps Senegal's smallholder crops with 84% accuracy on sparse labels
Cambridge researchers' open-source Tessera model mapped crops in Senegal's groundnut basin correctly 84% of the time on a fraction of the usual labeled data. For agencies that can afford field surveys only every few years, the more useful result is that its maps held up best when trained on one year and applied to another.
The Scientist · Science desk
What happened
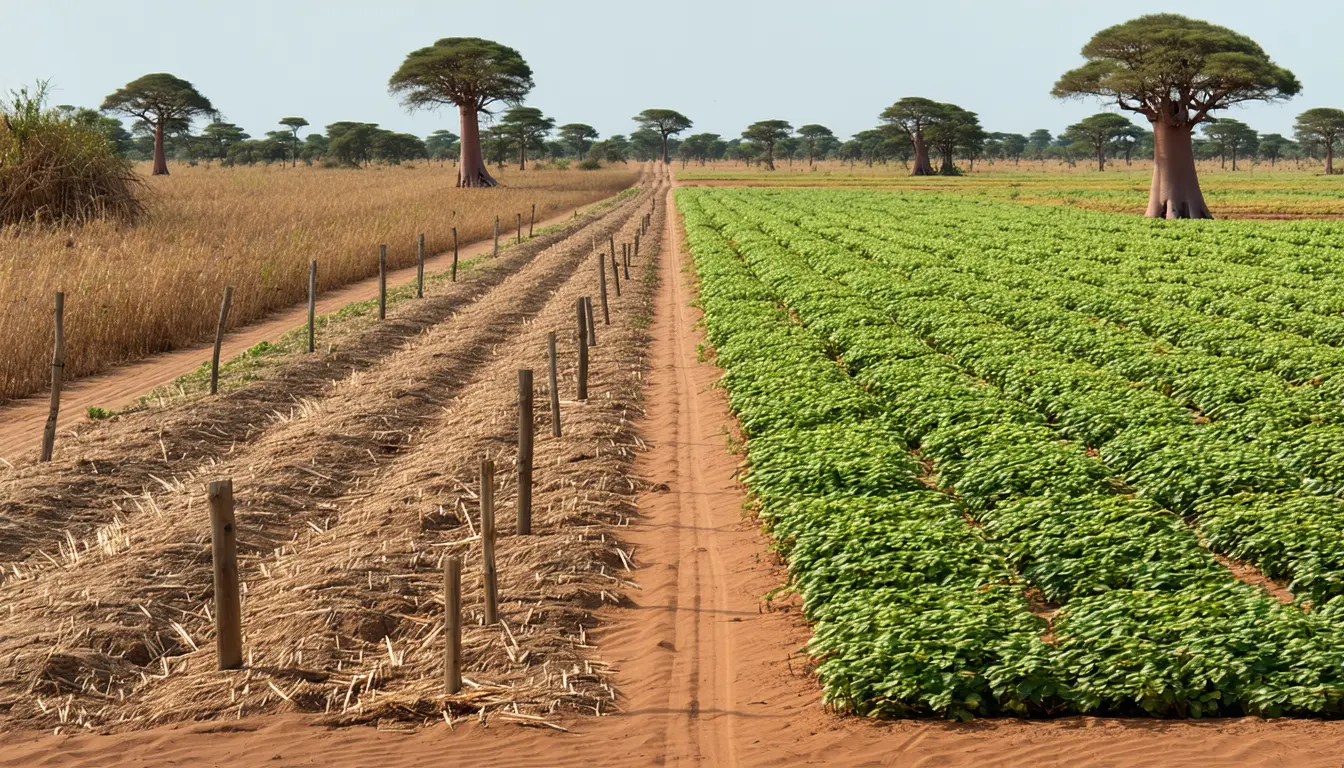
- The team compared Tessera with two widely used satellite crop-mapping methods and with Google DeepMind's AlphaEarth, a similar system whose underlying model is not public.
- Each method mapped the basin's crops for 2018, 2019 and 2021 and was scored on accuracy, reliability, reusability and computational cost.
- In one test scenario, Tessera performed 28% better than the next-best model.
- Lead author Madeline Lisaius helped develop Tessera as a doctoral student in Cambridge's Department of Computer Science and Technology.
- The study was published on Sept. 29 in the journal Environmental Research: Food Systems.
Compiled by The ScientistSomething wrong?How this is made
Why it matters
- decision An agency that surveys fields only every few years can consider filling the gap years with maps built from labels it already holds before it pays for another survey round.
- capability Because Tessera is open-source, a ministry or NGO can run and inspect the model behind its own crop statistics.
- exposure The published results come from a study led by one of Tessera's own developers, so an agency adopting it now relies on the builders' evaluation of their own tool.
An 84% hit rate means about 16% of test results were wrong, roughly one in six [1]. The phys.org report does not give the crop classes, the rival methods' scores, the basis of the 28% margin, or how the compute comparison treats the cost of generating embeddings [4][5].
Tessera splits crop mapping into two steps. In the first, the underlying model reads a year of satellite images and compresses each 10-meter point of land into an embedding, a string of numbers recording how that ground changes over time [16]. Then a simple algorithm, calibrated on a few labeled points, turns the embeddings into a crop map [17]. Ground labels enter only at the second step, so the method needs few of them. Few labels is what a basin like this one can supply. Plots there are not much larger than a football field [14], and current production estimates rest on slow field surveys or expensive processing of satellite imagery [15].
Compute splits along the same line. Fitting a simple classifier is a small, repeatable job [17]. Producing a year of embeddings for every 10-meter point across a region is a separate job [16], and a small agency's bill depends on whether it has to run that job itself.
The cross-year result bears on the constraint Lisaius, the study's lead author, describes. "Accurate and up-to-date crop statistics can guide food security planning and help decide where best to target support. But most local governments and bodies can only afford to collect ground data every few years," Lisaius said [7]. "With Tessera, you can train on the data you already have and extend it into the years in between, with more accurate crop information than baseline methods have ever been able to provide." [8]
According to the World Food Programme, Senegal's food comes mostly from small, rain-dependent farms, leaving much of the population vulnerable to climate shocks [1]. The thing this study doesn't tell you is how a map calibrated in an ordinary season handles an abnormal one. The phys.org report ties the work to this year's El Niño, which it says scientists call the strongest ever recorded, and notes that past strong events brought prolonged drought to West Africa [10]. The embeddings record how ground changes over a year [16]. If a failed rainy season changes that pattern, a classifier calibrated on a normal year's labels is working outside the conditions it learned from. I'd want to see the transfer tested on a known drought season before gap-year maps are used to target aid.
Lisaius said governments, NGOs and other food security organizations can begin producing their own crop statistics with it now [9]. "Reliable agricultural data is essential to anticipate food security and climate-related risks," said Pierre Lucas, the WFP's representative and country director in Senegal [11]. His description of the programme's own work is more tentative: "In Senegal, WFP is working with national partners to explore how geospatial data and artificial intelligence can strengthen food security monitoring systems and support faster, more informed decision-making." [12]
What to watch
- An evaluation of Tessera by a group that did not build it, in Senegal or in another smallholder region.
- Whether the WFP and its Senegalese partners move from exploring the approach to publishing crop statistics produced with it.