Leadership1 publisher3 min readPublished Updated
Robotaxis Are Taking Mid-Teens Share in Three Metros. Headcount Will Not Show It.
Waymo is estimated at 15-16% of ride-hail spend in San Francisco, Los Angeles and Phoenix. The labor cost lands in utilization and quiet exits, not in any number a dashboard tracks.
The Board Room · Leadership desk
Drafted by a language model from the sources cited here and checked against its claim ledger before publication. How we use AISend a correction
What happened
- Yipit, a market research firm, estimated that Waymo accounted for 15% of gross bookings (dollars spent on rides) in San Francisco and Los Angeles in June and 16% in Phoenix.
- In January, the Yipit figures were 16% in San Francisco, 17% in Los Angeles and 19% in Phoenix.
- Between January and June, Waymo's estimated gross-bookings share fell by 1 point in San Francisco, 2 points in Los Angeles and 3 points in Phoenix.
- Despite the caveat about expansions, Waymo's share remained in the mid-teens in all three markets through June.
- A Yipit spokesperson said the firm calculated shares among Waymo, Uber and Lyft by looking at trips that begin and end inside Waymo's operating zones, with estimates based on email receipts from a sample of about 1.5 million active US consumer accounts.
Compiled by The Board RoomSomething wrong?How this is made
Why it matters
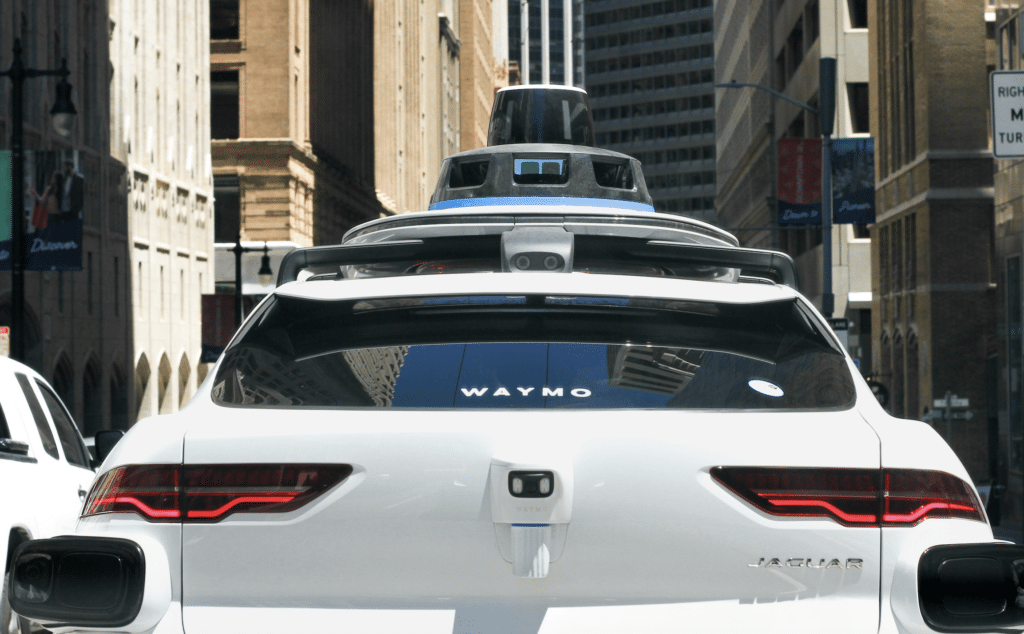
Market research firm Yipit estimates that Alphabet's Waymo accounted for 15% of ride-hail gross bookings in San Francisco and Los Angeles in June, and 16% in Phoenix [1]. What makes that interesting to operators is not the share but the shape of its cost: Gad Allon, a Wharton professor who studies the gig economy, told Business Insider that the earliest effects on human drivers would appear in utilization, longer waits between rides, fewer trips per hour and possibly more unpaid repositioning, rather than in a visible wave of job losses [9]. Utilization here means the percentage of a driver's online time spent on paid trips [10]. That is the metric being compressed, and almost nobody outside the platforms can see it. Allon called a 15% share a "serious shock" to the local labor market, diluted only because drivers also work outside Waymo's geofences [11], and said the reason it does not look like a shock is that "the adjustment runs through hours and exits rather than layoffs" [12]. Katie Wells, a senior fellow at the AI Now Institute who has studied Uber drivers, made the structural version of the same point: because drivers are independent contractors rather than employees, displacement may never register as a decline in employment [20]. Her summary of the state of knowledge was blunt: "We don't know how much, we don't know when, we don't know where" [19]. The share numbers themselves deserve reading with care. Yipit compared Waymo, Uber and Lyft only on trips beginning and ending inside Waymo's operating zones, using email receipts from a sample of about 1.5 million active US consumer accounts [4]. The figures measure dollars, not trips, so Waymo's share of actual rides could be higher or lower depending on relative pricing [5]. Yipit also cautioned that the share can appear to fall as Waymo expands into new areas where the service is initially less popular [6], and Waymo said in May it expected to add 60 square miles to its Bay Area footprint [7]. That caveat matters, because January figures were higher in all three markets: 16% in San Francisco, 17% in Los Angeles and 19% in Phoenix [2], declines of one, two and three points respectively [3]. Even so, the share stayed in the mid-teens in all three metros through June [c3b]. Uber's CFO, Balaji Krishnamurthy, circulated the Yipit data on X while discussing Uber's competitive position, saying Uber relies on internal tracking for decisions and offered the third-party figures as an external reference [8]. The indirect evidence points the same way as Allon's argument, without proving it. Gridwise data showed hourly driver wages declining in Austin, Los Angeles, Phoenix and San Francisco, all Waymo markets, while the national median rose 1% [13]; researchers told Business Insider the data could not establish robotaxis as the cause [14]. Uber CEO Dara Khosrowshahi told Fast Company in a June profile that the company is recruiting fewer drivers in some cities where AVs operate [15], while Uber has also said more drivers sign up organically as demand grows [16]. Lyft CEO David Risher, in prepared remarks for the August 6 second-quarter call, said the future is hybrid and the market will expand as AVs scale, noting Lyft rides inside San Francisco's AV operating area grew about 20% year over year [17][18]. Waymo and Uber did not respond to Business Insider's request for comment [22]. There is a second-order effect worth noting for anyone managing contingent labor. Wells and her coauthors tracked 40 Uber drivers over five years and found they felt less incentivized to push for better working conditions because they believed the work would disappear anyway [21]. Expectation of automation did the disciplinary work before automation arrived.