Science1 publisher2 min readPublished
Higher-income suburbs carried 30% higher odds of burning in 141 US urban fires since 1984
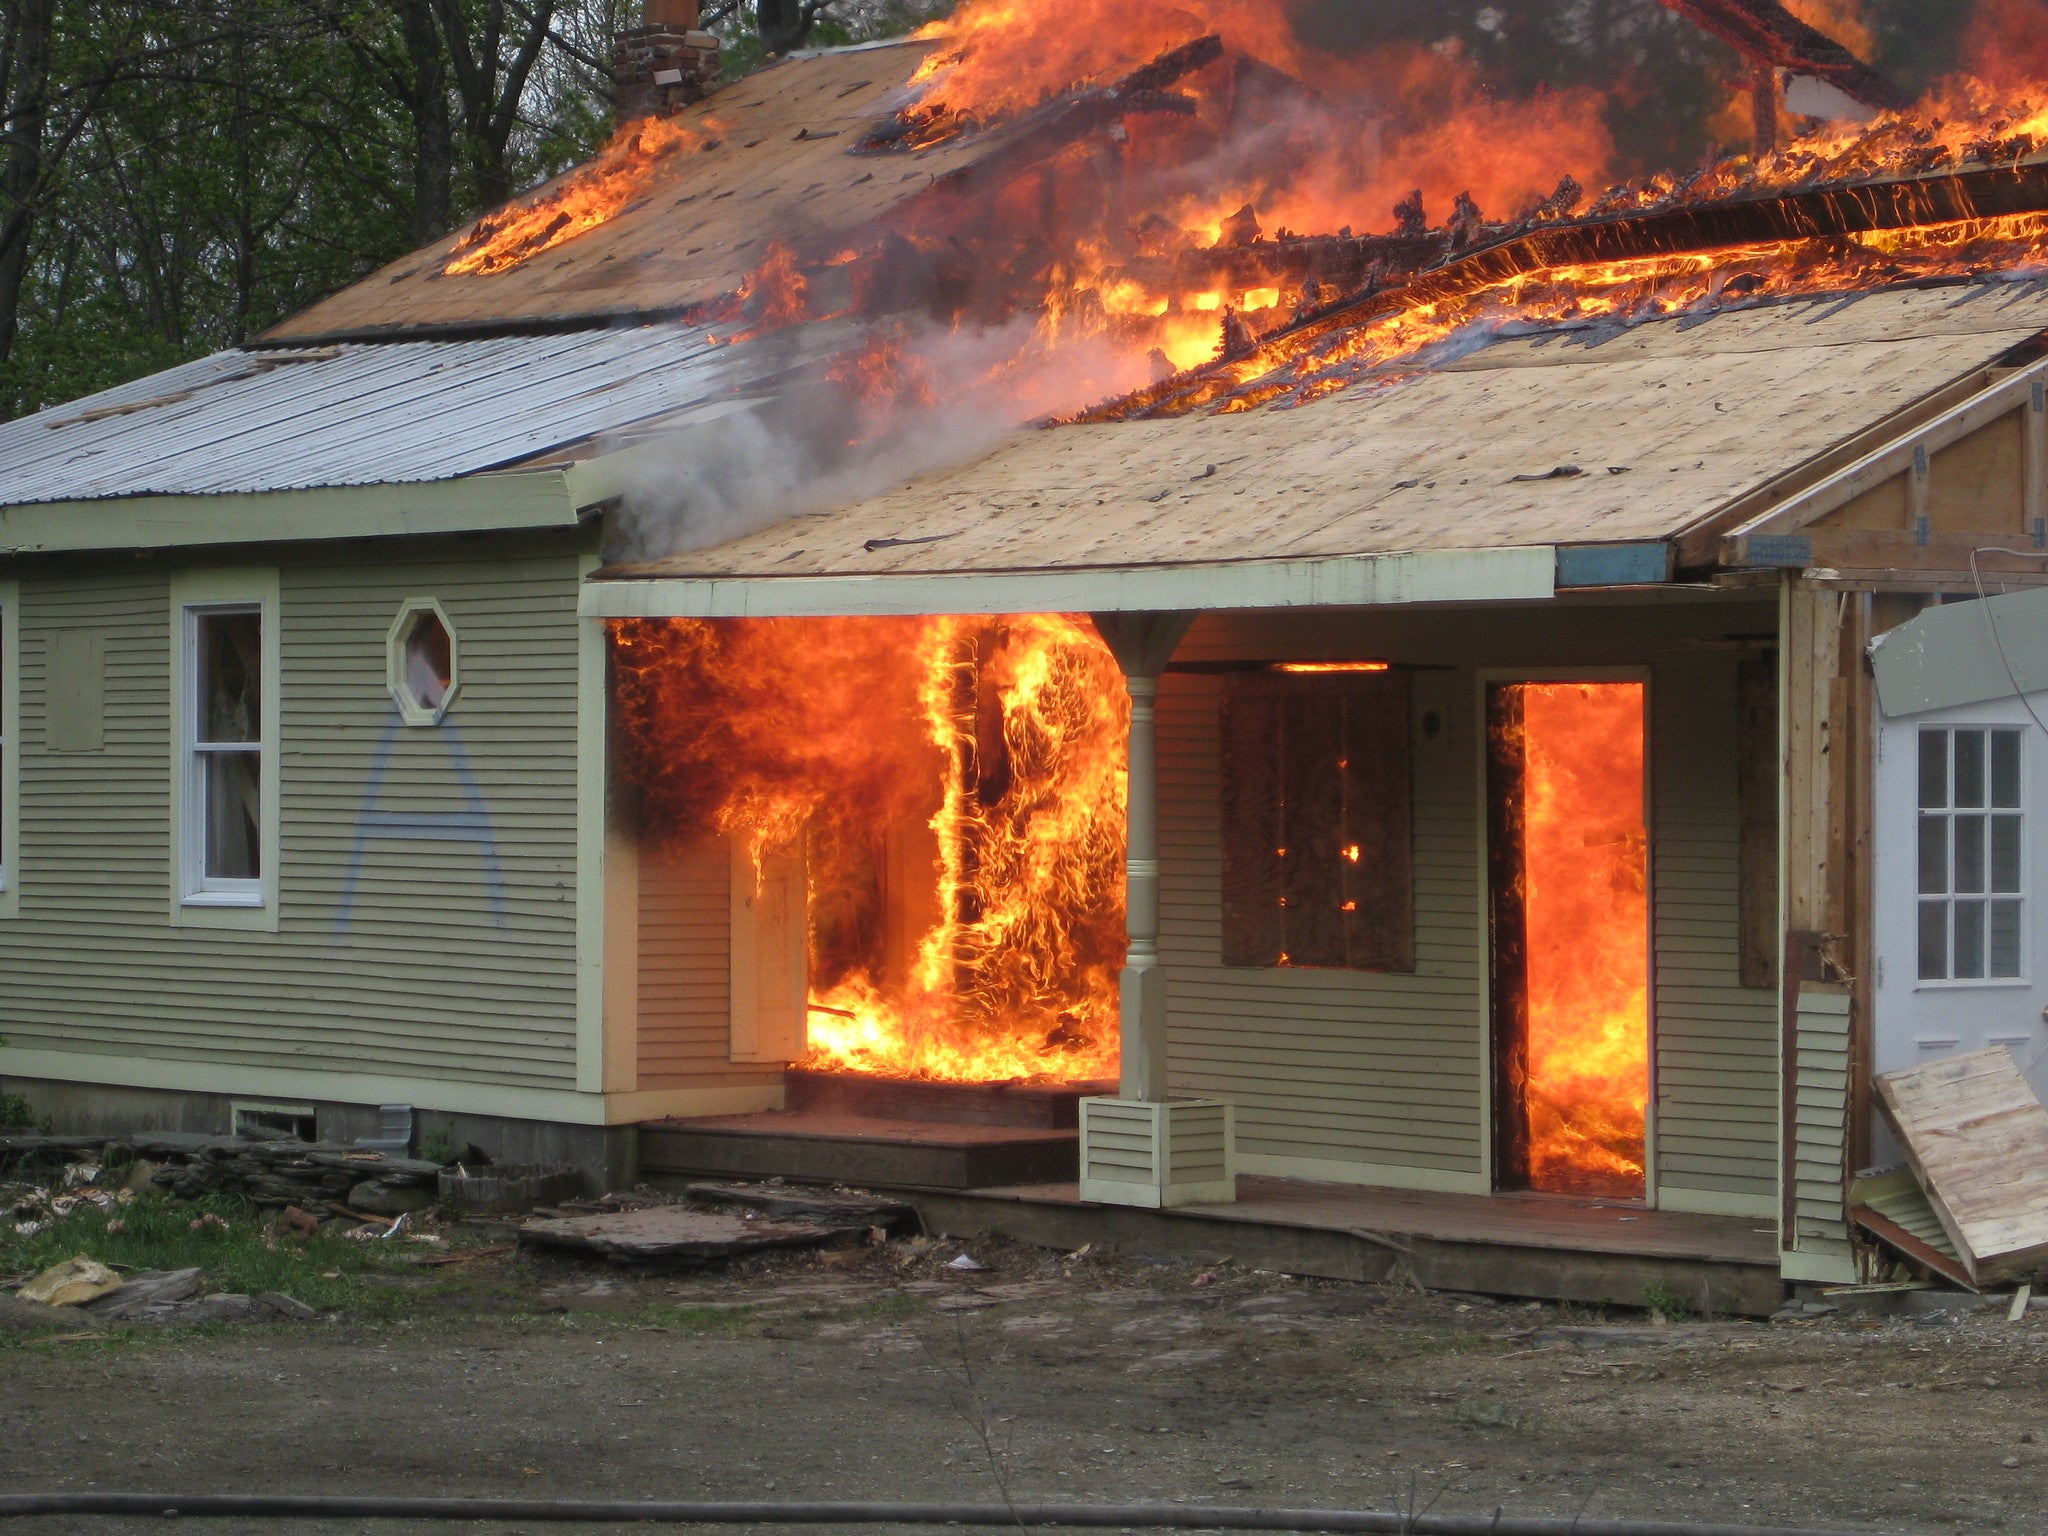
A UC Riverside team matched 141 fires that reached American cities since 1984 against income, tenure and climate data, and found exposure concentrated in owner-occupied suburbs that also recovered their vegetation fastest.
The Scientist · Science desk
What happened
- A UC Riverside team examined 141 fires that reached US urban areas since 1984, combining the fire records with population, development, climate and demographic data, and published the work in npj Urban Sustainability.
- Neighborhoods with substantially higher median incomes had about 30% higher odds of fire exposure, and the development that burned was consistently suburban and owner-occupied.
- The number of fires reaching urban areas showed no clear increase over the period, even as wildland fires grew larger and more frequent.
- The amount of urban land burned did rise, on a trend heavily influenced by a few especially destructive fire years.
Compiled by The ScientistSomething wrong?How this is made
Why it matters
- decision A fire manager choosing which index triggers extra staffing or access closures has grounds to swap multi-year drought products for three- to six-month moisture measures.
- constraint Because recovery here is greenness and surface heat, the study cannot settle where household recovery aid belongs; that case needs rebuild and occupancy records, and this design did not collect them.
- exposure Underwriters and homeowners at the wildland edge now have a published exposure pattern that tracks income. The authors did not test pricing, non-renewal or availability.
- contradiction Anyone lifting the national demographic coefficient into a western mitigation plan would target the wrong neighborhoods, since the study's own dry-West result runs the other way.
Income buys location, and in this record the location that burned was the hillside or canyon lot with wildland vegetation around it [4]. "These urban fires consistently occur in suburban, high-income, owner-occupied development," said Dion Kucera, the UC Riverside postdoctoral researcher in urban ecology who wrote the study [5]. "That hasn't changed in more than 40 years," he said [6].
The odds gap is about 1.3 to 1 [22]. It comes out of 141 fires spread across four decades and the whole country, or roughly three or four a year [21].
Recovery was measured with two satellite quantities: whether vegetation greenness and land surface temperature came back inside their pre-fire ranges in the five years after a fire [9]. Roughly a fifth of severely burned areas got their temperature back, and about a quarter their greenness [20]. Burned urban land was hotter and less green for years afterward [11]. Higher-income neighborhoods regained pre-fire temperatures faster and lost less vegetation [12].
Those are land cover results. These instruments do not show whether residents rebuilt, returned or sold, and the paper's own title describes what it found as unequal ecological recovery [19]. Shifting recovery aid down the income gradient is an argument about households, and it would need household data.
The result a city manager can act on is the antecedent. What preceded these fires was a short, intense drying of the environment in the six months beforehand [7]. "That suggests three- to six-month moisture measures may be more important for city managers trying to identify periods of heightened risk, rather than longer-term drought assessments," Kucera said [8].
The demographic results move with geography. Nationally, neighborhoods with higher proportions of white residents had lower odds of fire; in California and other dry parts of the West that relationship reversed, with white and Black populations facing greater odds [13]. The study did not examine insurance markets, and Kucera said additional research should explore those questions [16]. "The urban fire problem isn't just structured by climate like it is in wildlands," he said [17].
What to watch
- The paper's per-region sample sizes, which determine how much weight the reversed western demographic result can carry.
- Whether permit, rebuild or occupancy records reproduce the income gradient that the satellite recovery measures show.
- Whether the three- to six-month drying signal identifies high-risk periods in advance, as well as in hindsight on 141 past fires.