Science1 publisher2 min readPublished
Gold collisions at RHIC's lowest energies show a fluctuation dip that may mark the QCD critical point
Brookhaven's STAR experiment found a dip in collision-to-collision particle-flow fluctuations across about 1 billion gold collisions at 3 to 7.7 GeV. The researchers call it a hint of nuclear matter's long-sought critical point, short of proof.
The Scientist · Science desk
Drafted by a language model from the sources cited here and checked against its claim ledger before publication. How we use AISend a correction
What happened
- Physicists expected the size of that variation to change smoothly with collision energy; instead it shrank and then grew again.
- According to the team, the signal is strong enough that it is very unlikely to be a statistical accident.
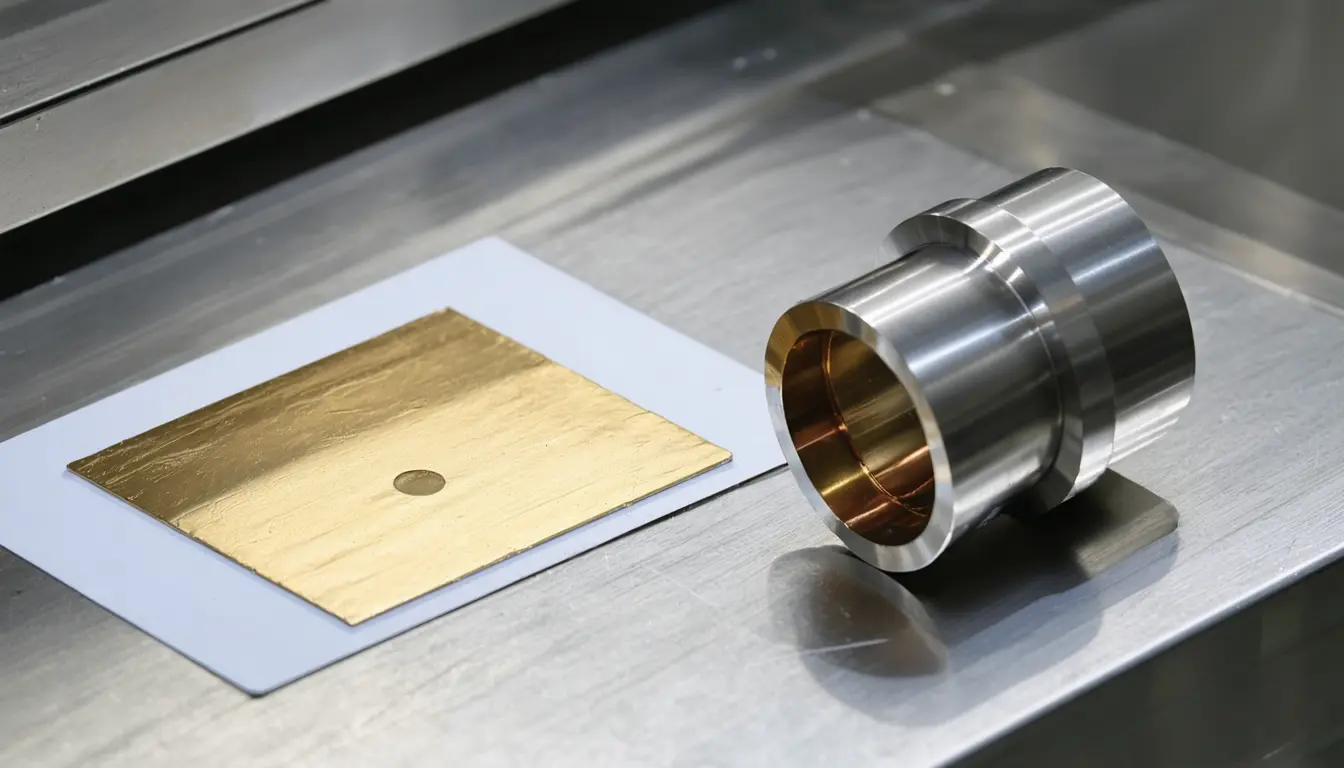
- For its lowest energies STAR used a fixed-target setup, firing a gold beam into a thin gold foil inside the detector to make RHIC's densest matter.
- Some recent calculations place the critical point within reach of RHIC's lower-energy collisions, the range STAR scanned.
- The results were published on Sept. 22 in Physical Review Letters.
Compiled by The ScientistSomething wrong?How this is made
Why it matters
- constraint Statistics can exclude chance but not ordinary physics that bends the same trend, so the critical-point reading has to beat competing models before it counts as a detection.
- capability Calculations that put the critical point in RHIC's low-energy reach now have a measured feature in the same window to be tested against.
- capability If the dip holds up, it would fix a landmark in nuclear matter's equation of state, the same description used for matter in neutron star cores.
The quantity STAR followed is the spread of an average. Each gold-gold collision flings charged particles sideways out of the fireball, and how hard they are flung, on average, shifts slightly from one collision to the next [2]. The team tracked the size of those shifts as it changed the beam energy [3]. Lower energy squeezes the colliding matter more tightly [7], so moving down the 3 to 7.7 GeV window [9] also means moving up in density.
For scale, one GeV is roughly the energy locked up in the mass of a single proton [10]. RHIC can reach 200 GeV [9]. The top of this window is under 4 percent of that ceiling [1].
The target is a feature of nuclear matter's equation of state. Rutik Manikandhan, a co-author and postdoctoral physics scholar at The Ohio State University [16], explained it with water. "For water, it tells you how pressure, temperature and density are linked, and therefore when it freezes, boils or expands," he told Live Science [13]. The critical point is one landmark in that description. "For water, it is the point where the boundary between liquid and steam disappears," he said [12]. Nuclear matter is thought to melt smoothly into quark-gluon plasma at extreme temperatures, while at higher densities the change may turn abrupt. The critical point would sit where one kind of transition becomes the other [14].
How much the dip counts for depends on figures a careful reader will want from the Physical Review Letters paper [6]. The first is the significance in standard deviations. Then there is the energy at which the minimum falls, how the roughly 1 billion collisions [9] divide among the energies scanned, and which models set the smooth trend the data were expected to follow [3].
I think the evidence supports a narrow claim. STAR has a departure from a smooth trend that the team says is very unlikely to be chance, in the energy range where some theory points [3][4][11]. What caused it is still open. Of the predictions themselves, Manikandhan said: "But all of this is still conjectured and there is nothing concrete yet, either from the experimentalists or theorists." [15]
What to watch
- Whether other fluctuation measurements in the same 3 to 7.7 GeV window show a feature at the same energy as this dip.
- Whether model calculations with no critical point built in can reproduce the shrink-then-grow pattern.
- Updated theory estimates of where the critical point sits, now fitted against a measured feature.