Science1 publisher3 min readPublished
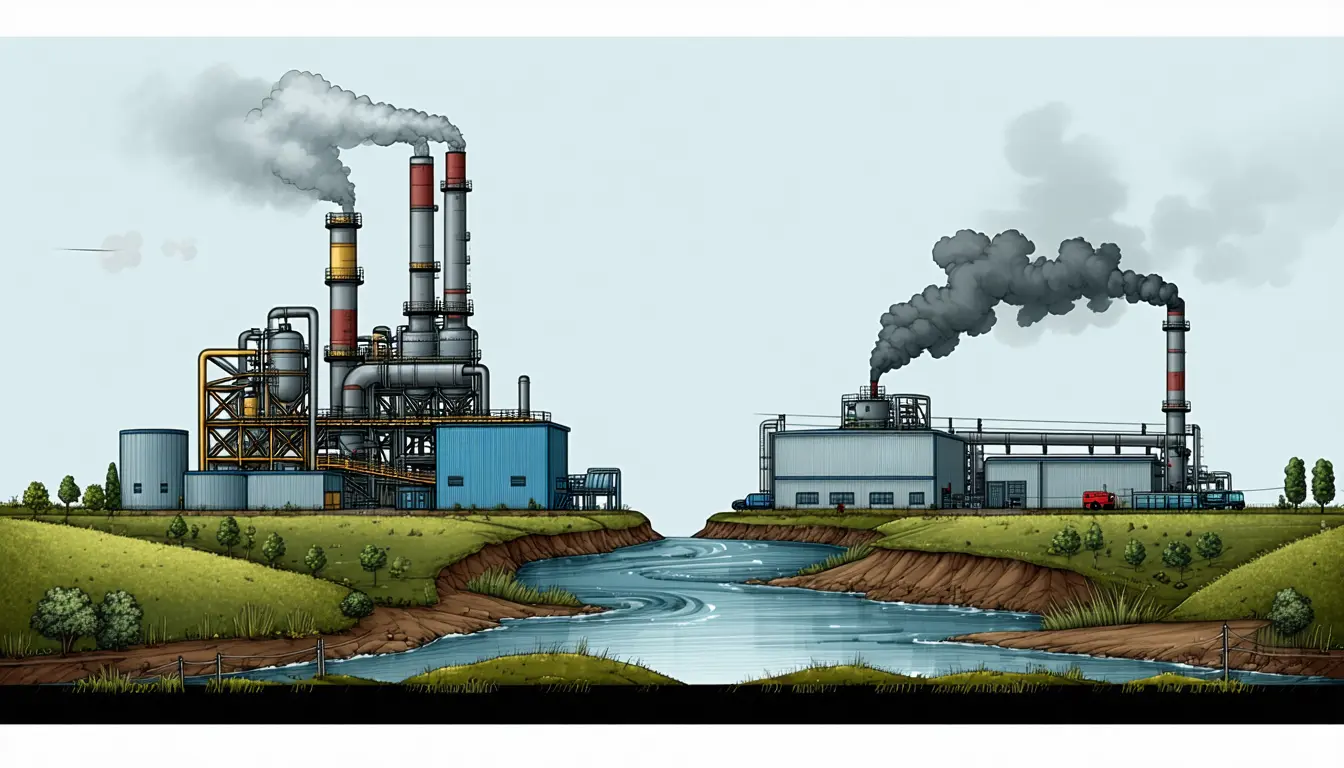
Industrial plants emitted about 30% less where a Democrat narrowly won the House seat
A study of 37,368 plants and 5,304 U.S. House elections from 1991 to 2016 finds abatement spending 47% higher in narrowly Democratic districts, with multi-plant firms letting emissions rise at their facilities elsewhere.
The Scientist · Science desk
What happened
- Industrial plants in U.S. House districts won narrowly by a Democrat emitted about 30% less on average than plants in districts narrowly won by a Republican.
- The analysis drew on 37,368 industrial plants and 5,304 U.S. House elections held between 1991 and 2016, a 25-year run of federal races.
- Plants in Democratic districts showed 47% higher investment in abatement technology and higher rates of postproduction treatment and recycling, with no major differences in productivity.
Compiled by The ScientistSomething wrong?How this is made
Why it matters
- constraint The close-race design is what identifies the effect, and it limits what the finding covers: the estimate holds where a seat was genuinely contested and cannot be extended to districts decided by wide margins.
- exposure People living near a multi-plant firm's other facilities absorb what gets moved, and the election that set it in motion happened somewhere else.
- cost Abatement budgets track who holds the local seat, so part of a firm's compliance spending is set by an election result it cannot control.
The estimate rests on close races. Where a seat is won by a wide margin, the party of the winner and the environmental preferences of the voters arrive bundled together, and no comparison of plant emissions can pull the two apart. The researchers built their core analysis on the subset of elections decided by small margins, arguing that voters on either side of a thin threshold want roughly the same things from a candidate [4]. So the 30% difference [1] describes contested districts and applies only to them.
A House member has little direct legislative purchase on a district, and most enforcement of Environmental Protection Agency rules happens at the state and local level [17]. The Clean Air Act of 1970 standardized limits nationally [18]. Stefan Lewellen of Penn State's Smeal College of Business, a co-author, said the kind of influence at issue leaves no paper trail: "One of the things that's tricky about political soft power is that there's never going to be a smoking gun" [10]. He also said: "You're never going to observe the phone call or the coffee meeting, so you have to look around the edges" [11].
The edges here are inspections. Permit limits can be set by the day, the hour or the minute, and they move with conditions such as temperature. That leaves inspections as the tool regulators use to catch irregularities [16]. After a narrow Democratic win, inspection rates ran about 34% higher and enforcement actions about 30% higher, most of them informal actions such as cease-and-desist letters rather than formal fines or investigations [9]. "Companies really dislike enforcement fines because they tend to generate negative publicity for the firm," Lewellen said [12]. Firms often comply, but only enough to avoid harsher penalties [13].
Plants in Democratic districts invested 47% more in abatement technology, treated and recycled more after production, and showed no major difference in productivity [7]. Wet scrubbers, which strip pollutants out of contaminated gas before release, are one available lever; lowering production is another [8]. On these numbers the reductions came out of equipment and post-processing. The spending gap is 17 percentage points wider than the emissions gap [22], and because the two percentages sit on different bases, the pair does not give a cost per unit of pollution avoided.
The paper appeared in the September print edition of The Review of Financial Studies [5], from a multi-institution team that includes researchers at Penn State [6]. Its counts are 37,368 plants and 5,304 House elections between 1991 and 2016 [3], a 25-year window [20]. The rounded description of nearly 40,000 plants runs 2,632 above the measured count, about 7% [21].
The within-firm result is the one that speaks to corporate strategy. A plant's emissions were higher when its parent firm's other facilities sat in districts held by Democrats, which the authors interpret as reallocation away from Democratic areas to recoup the higher investment cost [14]. They describe financial consequences for the firms and health concerns for the communities on the receiving end [15].
The inspection and enforcement gaps are reported as associations; the close-election design supports the emissions difference [9][4]. The reported results give district-level percentage differences and the direction of the within-firm shift. They do not include a net national emissions total [23].
What to watch
- Whether the full Review of Financial Studies paper reports a net emissions total across all of a firm's districts, which the summary does not.
- Whether state regulators' inspection logs can be matched to representatives' contacts, testing the soft-power route the authors say they cannot observe directly.
- Whether the pattern replicates in plant data after 2016, the last election year in the sample.