Science1 publisher2 min readPublished
Thirteen summers of pole readings put Qaanaaq Ice Cap's loss at eight metres of water
A Hokkaido University team drilled aluminum poles into northwestern Greenland's ice every summer from 2012 to 2025, and the record they built traces about half of the growing loss low on the glacier to the ice itself slowing down.
The Scientist · Science desk
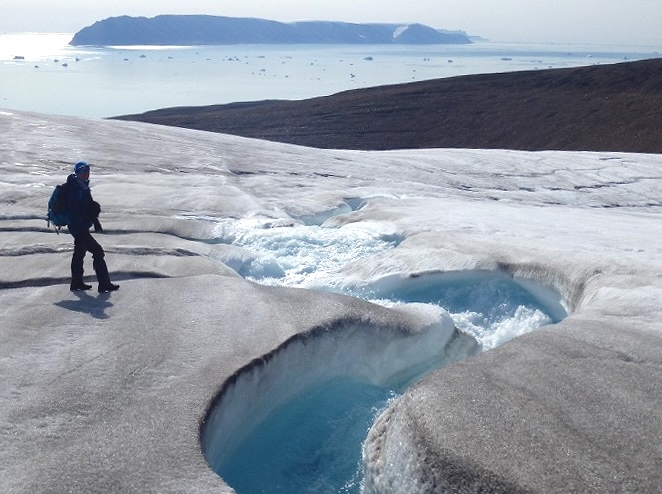
What happened
- Hokkaido University researchers measured aluminum poles drilled into the Qaanaaq Ice Cap in northwestern Greenland every summer from 2012 to 2025, reading the exposed length of each pole to track how far the surface had dropped.
- Across the whole ice cap, the loss over those 13 years amounts to a layer of water about 8 metres deep if it were melted and spread evenly over the surface.
- At Qaanaaq Glacier the surface fell by an average of 8.7 metres, with faster loss at low elevation than high and a rate that accelerated in the later years of the record.
- Surface melting and reduced snowfall did not account for the whole increase in loss, and changes in how fast the ice was moving carried part of it.
Compiled by The ScientistSomething wrong?How this is made
Why it matters
- constraint A model tuned to elevation change alone would hand the entire low-elevation thinning to warmer summers and come out with a melt sensitivity that is too high, because part of the signal is ice that stopped arriving from upstream.
- exposure Ice-loss budgets that treat peripheral glaciers as a rounding error on area will understate them, since their loss per square kilometre runs well above the island-wide average.
- precedent A series that continued through two seasons its own authors could not travel to makes community-collected measurement a workable way to keep long records unbroken, and not only a stopgap.
Surface lowering and melting are two different measurements. Ice flows into any point on a glacier from upstream, and how much arrives sets how much can melt away before the surface starts to drop. The group measured the arriving part by fixing GPS receivers to the same poles, surveying surface elevation at 280 locations and logging local air temperatures and snow conditions [4]. Warmer summers drove much of what the poles recorded [6].
"About half of the increase in ice loss in the lower part of the glacier was linked to changes in ice movement. As the glacier slowed, less ice flowed down from higher areas to replace the ice being lost in the lower parts," said Shin Sugiyama of Hokkaido University's Institute of Low Temperature Science, who led the study [8][17].
Averaged across the record, the 8.7 metres of lowering at Qaanaaq Glacier comes to about 0.67 metres a year [14]. The rate rose in the later years, so the recent summers ran above that figure and the early ones below it [6].
The 8 metres is a spread-evenly number: the depth you would get by melting the whole loss and pouring it back across the ice cap's surface [3]. The phys.org report does not state the ice cap's area. Without that, the 8 metres cannot be turned into a mass or into a contribution to sea level.
The paper, by Takuro Imazu and colleagues in the Journal of Glaciology, is described as a rare long-term record of glacier change taken directly from the ground in northwestern Greenland [12][13]. Glaciers and ice caps make up about 4% of Greenland's ice-covered area and accounted for about 14% of its total ice loss between 2018 and 2021 [10]. Dividing the second share by the first, they lost about 3.5 times as much per unit of area as the island-wide average [15].
"The most difficult part of the study was continuing these measurements for 13 years. This record fills an important data gap in northwestern Greenland and provides a foundation for future glacier research in the region," Sugiyama said [9]. Two of those thirteen years were covered by other hands: when the pandemic disrupted fieldwork in 2020 and 2021, local Greenlandic collaborators took the snow accumulation and ice loss measurements [11]. The team shares its findings with local communities each year and hopes to expand local participation in future monitoring [16].
What to watch
- Whether the velocity record shows the low-elevation slowdown continuing past 2025, since flow changes carried about half of the recent increase in loss there.
- Whether the team's plan to widen local participation turns the 2020-2021 arrangement into standing, community-run monitoring.
- Whether a published area for the Qaanaaq Ice Cap lets the 8 metres of water equivalent be stated as a mass.