Invest1 publisher3 min readPublished
BCG's richest-generation case pairs a median income at 28 with an average net worth at 34
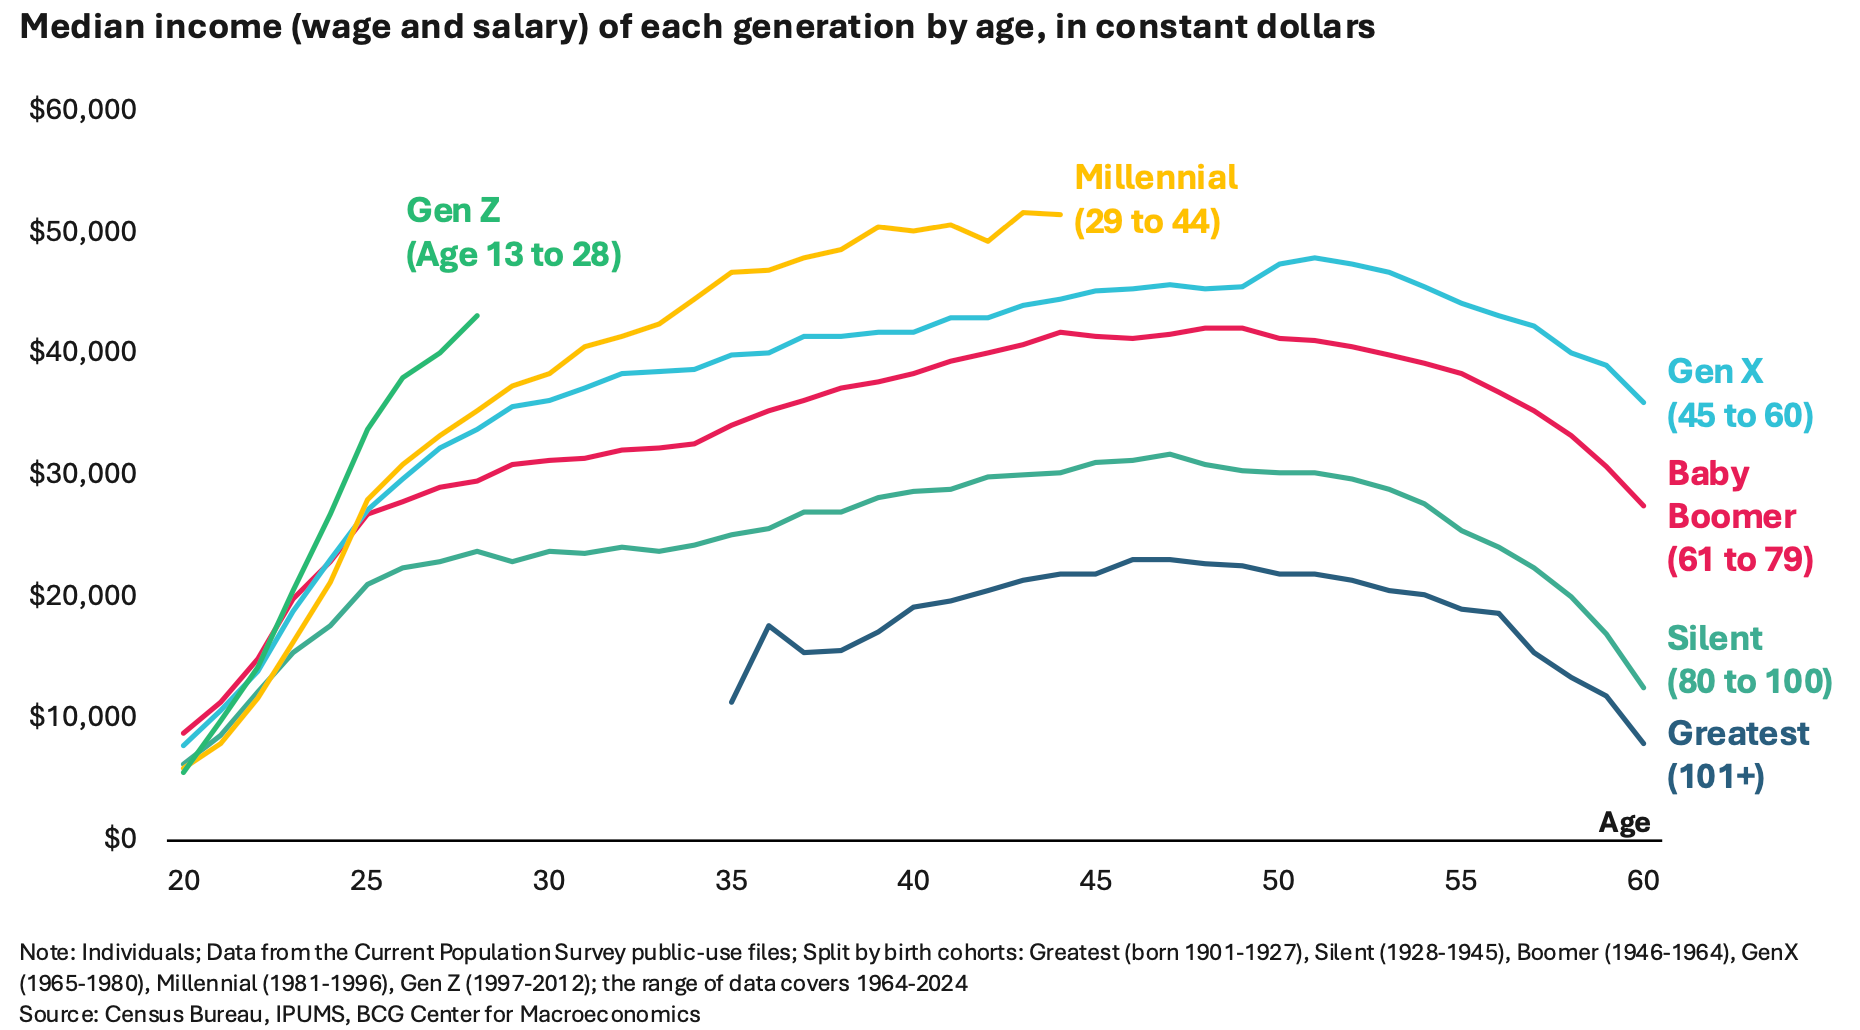
Economists at BCG put the oldest Gen Z workers at a median $42,000 in constant dollars, 25% above Millennials at the same age, and date the year the young became gloomier than the old to around 2025.
The Investor · Invest desk
What happened
- A BCG Center for Macroeconomics report by Philipp Carlsson-Szlezak, Paul Swartz and Henry Rubin argues Gen Z is richer at the same age than Millennials, Gen X or the Baby Boomers ever were.
- The oldest Gen Z workers, at 28, earn a median $42,000 in constant dollars, which the report puts 25% above what Millennials earned at that age and 50% above the Boomer figure.
- For wealth the report uses Millennials at 34, whose average net worth of $331,000 compares with $251,000 for Gen X and $229,000 for Boomers at the same age.
Compiled by The InvestorSomething wrong?How this is made
Why it matters
- decision A business selling to this cohort has to decide which figure sets price, because the $42,000 median describes what a 28-year-old can pay and the 46% describes what that customer will agree to pay.
- constraint The wealth evidence sits at 34, so a lender or subscription business using it to underwrite a 28-year-old is extrapolating six years of earnings that have not happened yet.
- contradiction BCG grants that student debt and city housing costs are real, while SoFi takes the same survey to show Gen Z overlooking how well off it is. That leaves room for the gloom to be accurate about prices and wrong about income.
- precedent With the age pattern in confidence reversed since around 2025, anyone who has been treating youth pessimism as a demand signal now gets the opposite read from the income series.
Run the income comparison backwards and the other cohorts appear. A 25% lead over Millennials implies a Millennial median near $33,600 at 28, and a 50% lead over Boomers implies about $28,000 [4][1][2]. The gap between a 28-year-old on today's median and a Boomer at the same age is roughly $14,000 in constant dollars [3].
The wealth exhibit is built differently. BCG says Gen Z on its own is too young for meaningful comparisons, so the net worth case runs through Millennials at 34. Their average of $331,000 sits $102,000 above the Boomer figure and $80,000 above Gen X at that age [5][6][4]. One number is a median at 28 and the other an average at 34, six years further into a career [6]. An average net worth is pulled up by the top of the distribution.
Sentiment moved the other way, and recently. Pollsters found older Americans reliably gloomier about the economy than younger ones from at least 1980 until the pattern flipped around 2025, the first time on record that the young were the more pessimistic group [7]. The SoFi/YouGov survey of 4,090 US adults puts a size on the gap: 62% of Gen Z and Millennials aspire to retire comfortably, and 46% believe they will [8]. Sixteen points, or about one in four of the people who want it not expecting to get it [5]. SoFi describes the cohort as "financemaxxing" and "lifemaxxing", weighing the "emotional ROI" of how far their money goes [9].
"I have empathy for Gen Z," Philipp Carlsson-Szlezak, BCG's global chief economist and a co-author of the report, told Fortune over email. "They were the guinea pigs of the smartphone revolution, and they had little help from parents and educators to build effective filters to distinguish TikTok from IRL." [10][11]
What a seller gets from this material is income, net worth and poll answers; Fortune's account of the report does not include a consumption or savings figure [7]. So the capacity number and the willingness number have to be read against each other. I would price the ceiling off the $42,000 median and the promotional mix off the 46%, and the reason is the hedge BCG writes into its own report: "Our analysis of generational progress is not a claim that all is well for all. Rather, it is a push back against the thin claims that all is wrong" [12]. The authors name student debt and housing affordability as the cohort's unique challenges, and conclude that "even so, they are making broad generational progress" [13].
The report opens on an 1866 complaint from a health magazine, Hall's Journal of Health, in a piece titled "The Men Won't Propose": "It requires a little fortune, now, to buy a house, and every article of furniture costs about three times as much as it did ten years ago" [1][2].
This goes differently for anyone allocating a marketing budget against the cohort. If outlays track the 25% income lead, the gloom is a survey artefact, and a discount aimed at it gives away margin to a customer who was going to buy anyway. If student loan service and city rents absorb the whole $14,000, the pessimism is measuring prices that the constant-dollar income series does not capture, and the poll answer is the better predictor of what sells [3].
What to watch
- A published spending or savings series for the 28-to-34 cohort would settle whether the income lead or the sentiment reading predicts outlays.
- Whether the 2025 reversal in age-based pessimism holds in the next polling wave or is a single-year result.
- Whether BCG publishes the distribution behind the $42,000 median, since a median income and an average net worth are not the same measure.