Invest1 publisher3 min readPublished
Pew counts two-thirds of planned US data centers in rural counties
Pew Research Center finds 67% of the 1,500-plus US data centers in development are planned for rural areas, while 87% of about 3,000 running now are urban. Many developers are building their own power on site, so county boards now set the pace.
The Investor · Invest desk
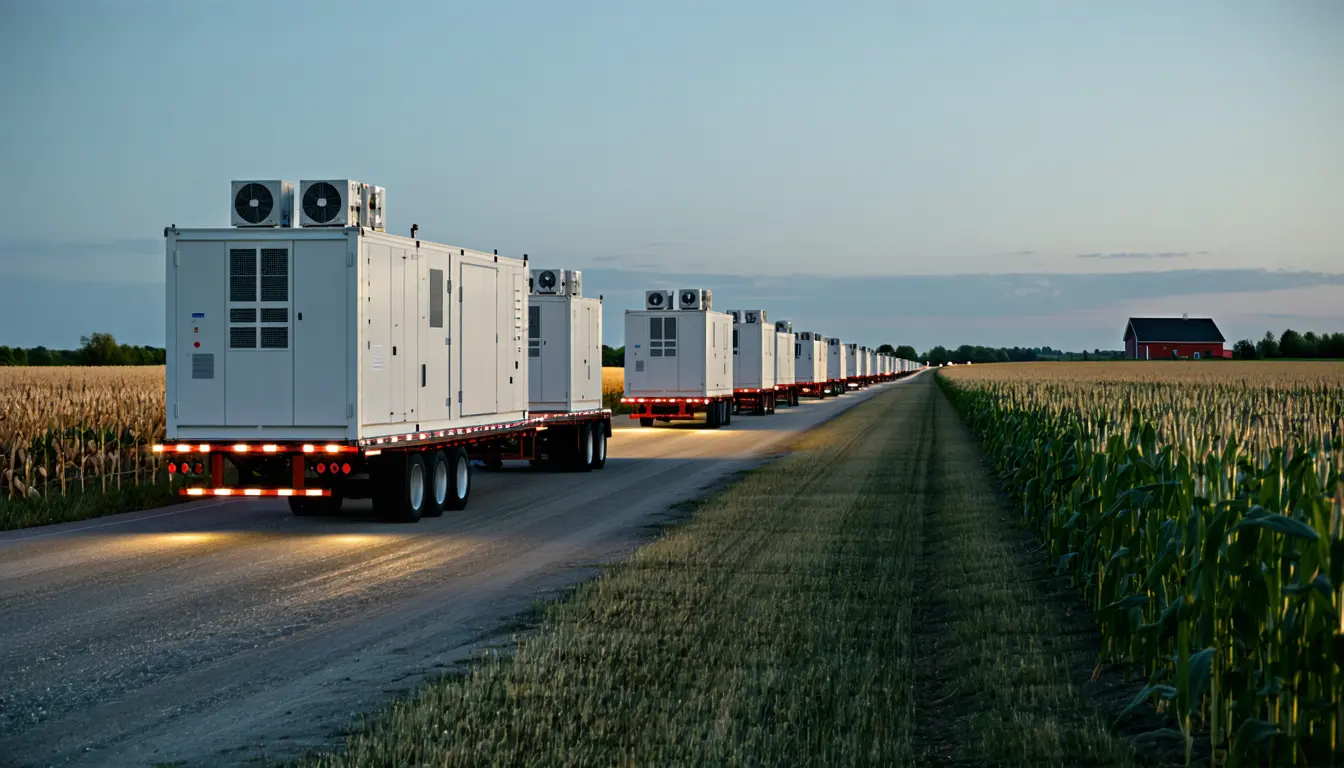
What happened
- Nearly 40% of the planned facilities are headed for counties that do not host a single data center today.
- The rural South accounts for 754 of the new facilities, the largest regional share, and the Midwest follows with 419.
- Amazon Web Services, Microsoft and Google are all securing rural land and power agreements across the South and Midwest.
Compiled by The InvestorSomething wrong?How this is made
Why it matters
- contradiction The two regional counts add to 1,173, more than the roughly 1,005 rural projects that 67% of 1,500 implies, so either the pipeline is well above 1,500 or the regional figures include urban sites.
- cost Developers adding turbines and batteries on campus pay up front for generation that a utility would otherwise build and recover through rates.
- exposure Residents in counties new to data centers take on cooling-water demand and the risk that one campus pushes up power rates for everyone else on the local grid.
- decision Each county board now chooses between fast-tracking projects and halting them, and that local vote decides where much of the pipeline lands.
Take Pew's count at face value and 67% of 1,500 is about 1,005 rural projects [1]. The 13% of roughly 3,000 operating sites that sit outside urban areas comes to about 390 [2]. The pipeline therefore holds about 2.6 rural projects for every rural data center running today [4]. Pew's total is "more than" 1,500, so that ratio is a floor [1].
The hyperscale figures say more about power. The 120 campuses under construction and the 460 in planning add up to 580 [5]. At the 100-megawatt threshold that defines the category, they come to at least 58 gigawatts of peak draw [6]. US data centers used about 192 terawatt-hours in 2024 [9]. Spread over the 8,760 hours in a year, that works out to an average load of about 22 gigawatts [7]. Peak draw and average use are different measures, and not every campus will run flat out. Even so, the floor of the hyperscale pipeline is more than two and a half times what the whole fleet averaged in 2024 [8]. Projections cited in the report put data centers at 9% to 17% of US electricity by 2030, two to almost four times the current share [10][9].
For decades the industry clustered near metro customers and fiber [15]. The report explains the move by saying urban grids in the old corridors are running out of room [18], while rural counties offer more available power capacity along with cheaper land and fewer permitting bottlenecks [14]. The same report says many developers are putting natural gas turbines, batteries and renewables on their own campuses to avoid local grid constraints [11]. Part of the reason is so they can tell residents their rates will not rise [17]. Some of the newest campuses are designed at gigawatt scale [7]. At the report's ratio of 80,000 homes per 100 megawatts [8], one of those draws what about 800,000 homes would [11]. I think what a rural county sells is acreage on which a developer can build its own supply, and a permitting process short enough to let it. Pew's figures, as reported, do not separate how much of the move comes from power and how much from land and permits.
Most of the eventual total depends on conversion: the 460 planning-stage hyperscale projects outnumber the 120 under construction almost four to one [10]. County politics could decide it instead. Some local governments offer tax incentives and fast-track permits, while others impose moratoriums or require environmental impact studies before construction [13]. Or on-site generation spreads until each campus is a private power plant with its own approvals to win. I'd expect the county vote to be the binding limit. The counter-thesis is that power stays the limit and local resistance fades as campuses supply themselves. The siting view is wrong if the projects that reach construction hold near Pew's 67% rural share as moratoriums spread, and right if the rural share falls between planning and construction [1].
What to watch
- A fuller Pew breakdown that shows whether the South and Midwest regional totals count rural sites only.
- Whether moratoriums or impact-study requirements appear in Texas, Virginia and Georgia, the report's main hotspots.
- Whether rural utilities sign gigawatt-scale supply agreements or developers keep adding their own turbines and batteries.