Science1 distinct publisher2 min readPublished
By September 3 the Northeast Pacific had 15 named storms and six hurricanes against the Atlantic's five and none, the split forecasters called back in spring. A basin tally, though, says nothing about where the rain lands.
The Scientist · Science desk

Compiled by The ScientistSomething wrong?How this is made
The scorecard runs on arithmetic, and the arithmetic checks out. If 4.4 units of accumulated cyclone energy is about 9 percent of normal for September 3, then normal for the date is near 49 units (4.4 divided by 0.09), leaving the Atlantic roughly 45 units short at the peak of its own season [5][17][22]. Divide the other way in the Pacific and 130 at 50 percent above normal implies a norm near 87 (130 divided by 1.5) [6][18]. One basin is therefore carrying about thirty times the other's storm energy while carrying three times its named storms [19][20]. That gap between the two ratios is the index doing its job: ACE weights intensity and duration together, so five weak, short-lived systems score close to nothing [7].
Crediting the mechanism matters more than crediting the tally. NASA's Earth Observatory describes El Niño warming the eastern and central Pacific, which supplies fuel there, while shifting large-scale circulation so Atlantic storms are harder to sustain [8]; the Atlantic's specific handicap this year is unfavorable wind shear [4]. A single season landing on the correct side of normal in both basins is one draw from a distribution. It cannot isolate El Niño's contribution from the ordinary year-to-year variance, and the numbers here are dated September 3, near the climatological peak rather than at the end of it [2].
Worth separating the picture from the evidence. The DSCOVR image was taken from nearly a million miles out and is a coincidence of geometry [16]; the verification rests on a statistics table compiled by Colorado State University meteorologists [5].
The scorecard leaves out where the water goes. The same image caught Tropical Storm Edouard over Louisiana and Texas just after landfall, where it downed trees and power lines [9][14]. Edouard never became a hurricane, and it contributed almost nothing to a basin index sitting at 4.4 [4][5]. National Weather Service meteorologists put rainfall in some areas at 15 to 24 inches [15]. So an Atlantic running at 9 percent of normal energy still put two feet of rain on inhabited ground, which is the distance between a seasonal outlook that verifies and a season that costs you nothing.
The Pacific side of the same forecast is where the intensity went. Lowell held category 5 winds for several hours on September 2 while Karina, a few thousand kilometers east, reached category 4, a rare simultaneous pairing in that area [11][12]. Marie was still a tropical storm southwest of Baja California when the image was acquired, and strengthening [13]. None of that is visible in an Atlantic-only reading of the season.
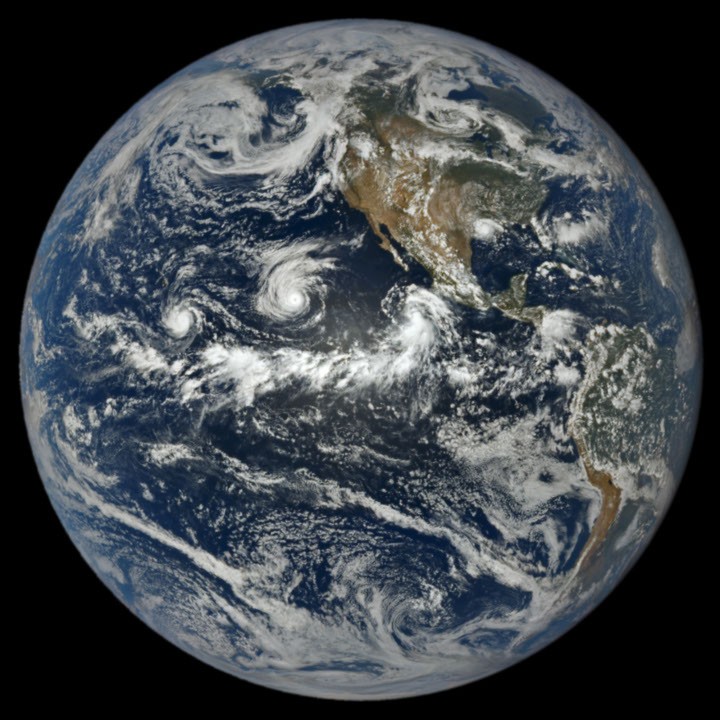
Ranked by verification strength, evidence, and original report placement.
When hurricane forecasters released seasonal outlooks in spring 2026, the El Niño brewing in the Pacific contributed to predictions of below-normal activity in the Atlantic basin and above-normal activity in the northeastern and central Pacific basins.
In early September, near the climatological peak of hurricane season, NASA's Earth Observatory said those spring outlooks were on target, with the eastern Pacific active and the Atlantic notably quiet.
As of September 3, the Northeast Pacific had produced 15 named storms and six hurricanes, well above the norm for that point in the season.
As of September 3, the Atlantic basin, laboring under unfavorable wind shear conditions, had produced just five named storms and no hurricanes.
As of September 3 the Atlantic basin's total accumulated cyclone energy index was 4.4, about 9 percent of normal for that date, according to statistics compiled by Colorado State University meteorologists.
The Northeast Pacific basin's accumulated cyclone energy was 130, about 50 percent above normal.
Distinct publishers with included, body-backed reporting in this cluster.
1 article · September 3, 2026
Follow any of these and your For You feed starts watching them — no settings page required.
leadership
A 75% Chance Of A Quiet Atlantic Is Not A 75% Chance Your Site Stays Dry1 distinct publisher
science
Petermann's 76-square-kilometer ice island survived its first collision intact2 distinct publishers
science
Addis Ababa's soot baseline lands one year after Ethiopia banned combustion-engine imports2 distinct publishers
science
A record-low snowpack, then a drought emergency: Tacoma Power runs its dams on satellite forecasts1 distinct publisher
Evidence-backed comparisons of source perspectives and observed adoption signals. Read the methodology
Which Builder, Operator, and Investor concerns the observed source mix emphasized—not a truth score.
Evidence, demonstrated adoption, hype gap, incentives, and confidence are assessed independently, each on its own current evidence. How these are measured.
Primary numbers, single desk
Every figure that matters — 15 named storms against five, ACE of 4.4 against 130, the 15 to 24 inches Edouard left behind — reaches a reader through NASA, which names Colorado State University and National Weather Service meteorologists as its sources but stands alone in our coverage. Strong provenance, thin corroboration: no one else in this reporting has checked the tallies, and the September 3 dating means the numbers are a snapshot of a season still running.
Nothing here to take up
This is a season-in-progress snapshot, not a thing anyone deploys. The reporting records no use of the imagery, the Worldview tracking tools it points to, or its ACE framing by anyone outside NASA, so we leave the dimension unscored rather than manufacture a number for it.
Sober prose, one framing to watch
For a satellite picture with a category 5 in it, the writing is remarkably flat — no superlatives, no doom. The small stretch is 'those spring outlooks were on target,' which grades a forecast in early September on a season whose peak is not finished, and the ACE contrast that invites reading a quiet Atlantic as a safe one. Edouard, sitting three paragraphs above the statistics with two feet of rain on the Gulf Coast, is the story's own rebuttal.
The agency owns the camera
NASA is describing an image made by its own instrument and closes by steering readers to Worldview and Earthdata for hurricane tracking and damage assessment — an institutional interest in the platform being seen as useful. It is visible rather than hidden, and it does not reach the numbers: the storm counts and rain totals belong to Colorado State and the Weather Service.
Facts we would defend, in one voice
Dated instrument, named storms, cited statistics compilation: the observational core holds up. What holds it back is arithmetic and arithmetic alone — the implied normals near 49 and 87 units are inferred from rounded percentages — plus the plain fact that a story told by a single publisher leaves nowhere for a competing reading to appear.