Published · yesterdayScience2 min read
The 20-30% nobody prints: what "83% of human consistency" is a share of
A Stanford-style agent study reports accuracy as a fraction of people's own two-week test-retest consistency. The missing 17 to 26 percent is the part that decides whether simulated panels are usable.
Written for builders.See today for builders
What happened
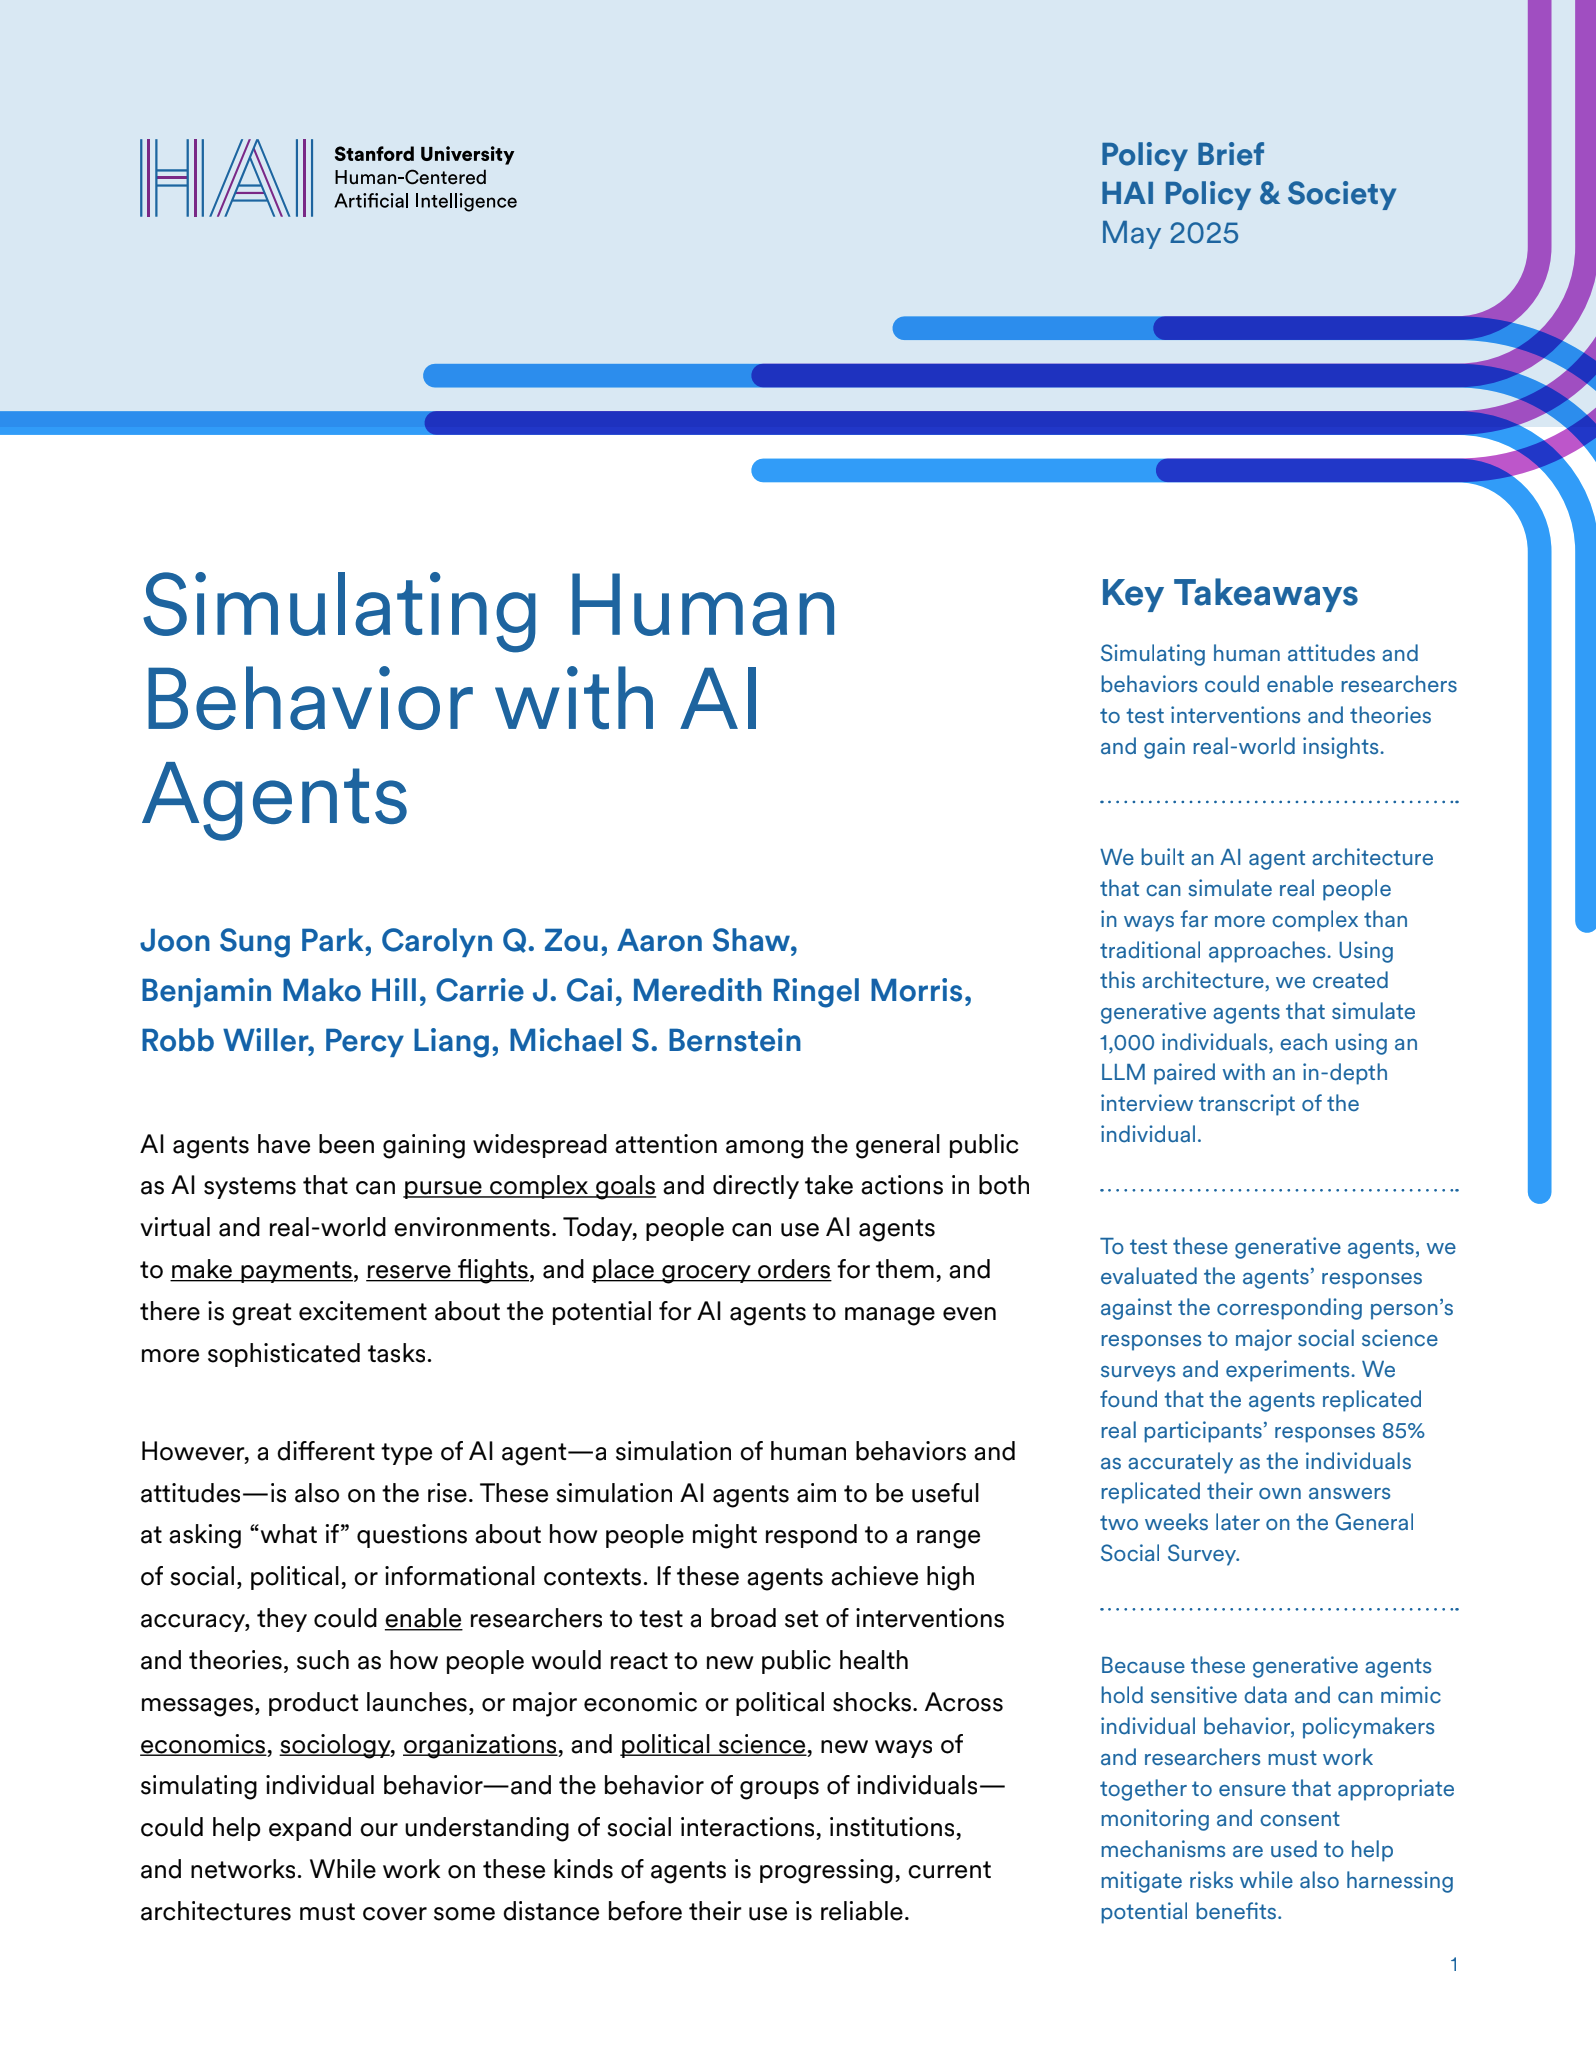
- The study used data from a diverse national sample of 1,052 Americans and built agents from two-hour semi-structured interviews (American Voices Project schedule), structured surveys including General Social Survey items and the Big Five inventory, or both combined.
- On held-out General Social Survey items, interview-only, survey-only and combined agents achieved accuracies equal to 83%, 82% and 86% of participants' own two-week test-retest consistency benchmark.
- Demographics-only agents achieved 74% of the same test-retest consistency benchmark.
- Combining interviews and surveys produced the highest accuracy, though gains over either source alone were modest, which the authors say suggests predictive benefits from data begin to asymptote once the model has observed sufficient evidence within a domain.
- The agents also predicted personality traits, economic-game behavior and experimental responses, while reducing accuracy disparities across racial and ideological groups relative to demographics-only agents.
Compiled by The ScientistSomething wrong?How this is made
Why it matters
Read the figure carefully and it is a ratio, not an accuracy. The agents scored 83, 82 and 86 percent *of* the participants' own two-week test-retest consistency, with demographics-only agents at 74 percent [2][3]. That benchmark is a person answering the same General Social Survey items twice, two weeks apart, and disagreeing with themselves some of the time [7]. Divide by it and you have normalised away the part practitioners most want to know: how much of the remaining gap is agent error and how much is the instrument.
The interesting number is the one left over. Against that human ceiling, the best configuration still misses 14 percent, and interview-only or survey-only agents miss 17 and 18 percent [6]. Two hours of semi-structured interview per person, on 1,052 people, buys you that [1]. And the authors say combining interviews with surveys produced only modest gains over either source alone, which they interpret as predictive benefit asymptoting once enough within-domain evidence has been seen [4]. If more data mostly stops helping, the residual is where persona fidelity lives, and it is not obviously shrinkable by collecting more.
The subgroup claim is worth reading as written. The paper reports reduced accuracy disparities across racial and ideological groups relative to demographics-only agents [5]. Reduced relative to a baseline that had only demographics to work with is a low bar to clear, and the paper as abstracted does not put a floor under per-group accuracy. A niche group is exactly where a percentage-of-consistency ratio hides trouble, because its own test-retest denominator is estimated from few people.
Then there is what happens when the output reaches a human. In the innovation-screening experiment reported by CIO, 228 evaluators assessed nearly 50 MIT challenge submissions and accepted LLM recommendations 67 percent of the time, agreeing with black-box and narrative recommendations around 75 percent of the time but with human decisions only 54 percent [8]. Narrative explanations cut false positives and substantially raised false negatives, because, the researchers argue, a persuasive rationale suppresses independent verification [9]. A simulated panel that is 86 percent of the way to human self-consistency, delivered with a fluent explanation, is a tool designed to be over-trusted.
Claim ledger
Ranked by verification strength, evidence, and original report placement.
- [1]
The study used data from a diverse national sample of 1,052 Americans and built agents from two-hour semi-structured interviews (American Voices Project schedule), structured surveys including General Social Survey items and the Big Five inventory, or both combined.
ReportedView cited source - [2]
On held-out General Social Survey items, interview-only, survey-only and combined agents achieved accuracies equal to 83%, 82% and 86% of participants' own two-week test-retest consistency benchmark.
ReportedView cited source - [3]
Demographics-only agents achieved 74% of the same test-retest consistency benchmark.
ReportedView cited source - [4]
Combining interviews and surveys produced the highest accuracy, though gains over either source alone were modest, which the authors say suggests predictive benefits from data begin to asymptote once the model has observed sufficient evidence within a domain.
ReportedView cited source - [5]
The agents also predicted personality traits, economic-game behavior and experimental responses, while reducing accuracy disparities across racial and ideological groups relative to demographics-only agents.
ReportedView cited source - [7]
The benchmark used as the denominator is participants' own two-week test-retest consistency on the survey items.
ReportedView cited source
Sources & coverage · 2 publishers
The reporting this story was synthesized from, earliest first. Every link goes to the original.
Additional citations
- Researchers associated with Harvard Business School, MIT and the University of Washington, reported by CIO