Product1 distinct publisher3 min readPublished
The Austrian diagnostics firm ranks the Mercedes EQA first and the Nissan Leaf last at 150,000 km, but two Leafs with the same odometer can differ by more than the best and worst models do, which changes what a buyer should pay to know.
The Product Desk · Product desk

Compiled by The Product DeskSomething wrong?How this is made
A remarketing manager holding the keys to two Nissan Leaf ZE1s with identical odometer readings can be holding two quite different assets. AVILOO puts the unit-to-unit gap within a single model at up to 13.5 percentage points of state of health, and says that spread generally widens as mileage climbs [14][15].
Set that against the league table. The Mercedes-Benz EQA tops the 20-model list at a median 94% SoH at 150,000 km, and the Leaf sits last at 86.3% [4][12]. Best median minus worst median is 7.7 points [20]. The worst case between two Leafs is 13.5 points, which is 5.8 points wider than the entire distance between the best and worst models in the study [21]. Testing the car tells you more than the badge does.
The ranking at 93,000 miles also owes more to where a model starts than to how fast it falls over that stretch. The Tesla Model Y goes from 94.5% at 50,000 km to 90.3% at 150,000 km, a drop of 4.2 points [9][22]. The Hyundai IONIQ 5 goes from about 97% to 92.8%, also about 4.2 points [7][23]. The slope is similar across that interval; only the starting height differs.
The reporting is not internally consistent on the IONIQ 5, which appears at 93.8% in the ranking and at 92.8% in the detailed figures for the same mileage [25]. A one-point difference between second and third place is inside the noise of the write-up, let alone inside the noise of a real fleet.
Percentages are abstract, so AVILOO converts one: the Model Y is estimated at roughly 379 km of real-world range at 50,000 km and about 362 km at 150,000 km, a loss of 17 km [10][24]. AVILOO adds that a 10% difference in battery health can be worth tens of kilometres, enough to decide whether a car finishes a run or needs another stop [16].
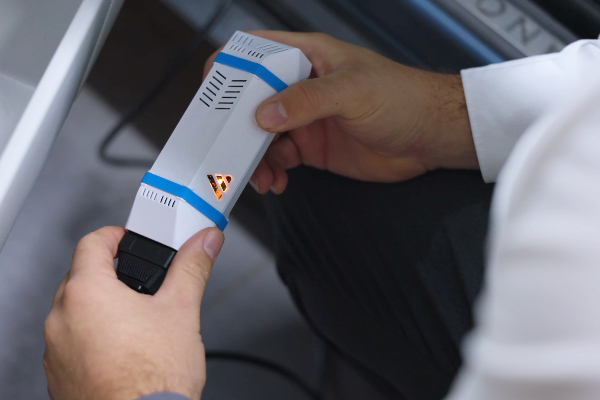
Teams tell themselves the odometer is the proxy for pack condition. AVILOO's own account of why identical models diverge names battery chemistry, climate, charging behaviour, and how long the car sits at a high state of charge [17]. Three of those four describe what the previous driver did, not what the manufacturer specified, which is also why the number on the dashboard is weak evidence. The study measures through the OBD port with a model trained on hundreds of thousands of used cars instead of reading the car's own display [18].
How many units you are buying determines which number matters here. Order thirty identical cars and the median is broadly what you get, so the 7.7-point model spread is the figure worth negotiating and the unit variance averages out across the order [20]. Buy one used car, or take one back at lease end, and the median tells you close to nothing; the 13.5-point unit spread is your exposure, and an independent reading is the cheaper of the two ways to discover which end of it you own [14].
AVILOO frames the overall result as reassuring for owners, and for an owner it is [19]. What the reporting gives a buyer is medians plus maximum spreads, with no per-model distributions or sample counts [26]. The residual-value risk sits in that tail, not in the median.
Ranked by verification strength, evidence, and original report placement.
AVILOO, an Austrian battery diagnostics company, analysed more than 500,000 independent EV battery tests covering 20 popular EV models, using real-world battery health measurements collected between 2022 and 2026.
The data is drawn from AVILOO's global database of more than 1 million independent tests across North and South America, Europe, Australia and Asia.
State of Health (SoH) is the percentage of a battery's original usable capacity that remains; a battery at 95% SoH retains roughly 95% of its original range per charge.
At 150,000 km (93,000 miles) the Mercedes-Benz EQA has the highest median SoH of the 20 models at 94%.
AVILOO's ranking lists the Hyundai IONIQ 5 second at 93.8% median SoH at 150,000 km and the BMW i4 third at 93.6%.
The Hyundai Kona EV and Volvo XC40 Recharge complete the top five, both retaining more than 92% median SoH at 150,000 km.
Distinct publishers with included, body-backed reporting in this cluster.
1 article · September 4, 2026
Follow any of these and your For You feed starts watching them — no settings page required.
product
AVILOO measures a 13.5-point battery health gap between used EVs of the same model1 distinct publisher
invest
China's record Tesla recall ships as labels and firmware. The 2027 handle ban is the bill.1 distinct publisher
invest
Tesla's Cybercab rally banks 5.4% before anyone outside Austin counts the cars1 distinct publisher
invest
Tesla stakes its robotaxi economics on a pod that seats exactly two1 distinct publisher
Evidence-backed comparisons of source perspectives and observed adoption signals. Read the methodology
Which Builder, Operator, and Investor concerns the observed source mix emphasized—not a truth score.
Evidence, demonstrated adoption, hype gap, incentives, and confidence are assessed independently, each on its own current evidence. How these are measured.
Precise numbers, one unchecked supplier
Every figure in this story — 94% for the EQA, 86.3% for the Leaf, the 13.5-point spread, the 379-to-362 km range estimate — reaches us through Interesting Engineering from the company that performed the tests, with no per-model sample counts and no distributions behind the medians. The one internal consistency check available fails: the IONIQ 5 is given as 93.8% and 92.8% at the same mileage within a few paragraphs. Large-n data is not the same as auditable data.
Vendor-counted volume, no outside uptake shown
The only adoption signal is AVILOO's own tally: a million-plus tests across four continents and an estimator trained on hundreds of thousands of used cars. That is a real deployment footprint if true, and it is the firm counting itself. Nothing here shows a dealer group, lessor, marketplace or regulator actually pricing or certifying cars off these results, which is the adoption that would make the study consequential.
Headline reassures, the data unsettles
Two overstatements pull in opposite directions and neither is flagged. Interesting Engineering's headline promises that top EVs keep more than 90% of capacity, which reads as a verdict on EV batteries generally when it rests on one firm's medians for twenty models. AVILOO calls the picture reassuring, yet its own spread numbers say a model average tells you almost nothing about the car in front of you — a conclusion that happens to sell the three-minute test AVILOO markets. The reporting does reach the nuance, just several hundred words after the ranking.
The finding sells the product
AVILOO's business is per-vehicle battery certification, and the study's central message is that you cannot know a used EV's battery from its badge or its odometer — you need a test. The specific test named, timed at three minutes and plugged into the OBD port, is AVILOO's own. That does not make the 13.5-point spread false; it does mean the most quotable line in the research is also the sales pitch, and Interesting Engineering passes it along without noting the overlap.
Single outlet, single supplier, one visible seam
One publisher, one source behind it, and an unexplained one-point discrepancy in the very model the story singles out as notable. The directional claim — capacity loss of a few points per 100,000 km, with wide car-to-car variance — is plausible and consistent with how packs are known to age, so we would not bet against it. The specific decimals deserve no weight until a second party measures comparable fleets.