Build1 publisher3 min readPublished
One alert, two causes, four green dashboards: the day the stack agreed and was wrong
A four-core ARM box thrashed its page cache for hours while Kubernetes reported Running, ArgoCD reported Synced and Healthy, Helm exited zero and an admission policy passed.
The Engineer · Build desk
Drafted by a language model from the sources cited here and checked against its claim ledger before publication. How we use AISend a correction
What happened
- Two days after a prior incident the author added seven new alert rules on a four-core ARM box, covering PSI, swap consumption, D-state counts and a forecast on the memory trend, as insurance against a repeat of an incident already fixed.
- On August 17th the new rules fired for something else entirely: the same rule twice in one day, for two root causes with nothing in common.
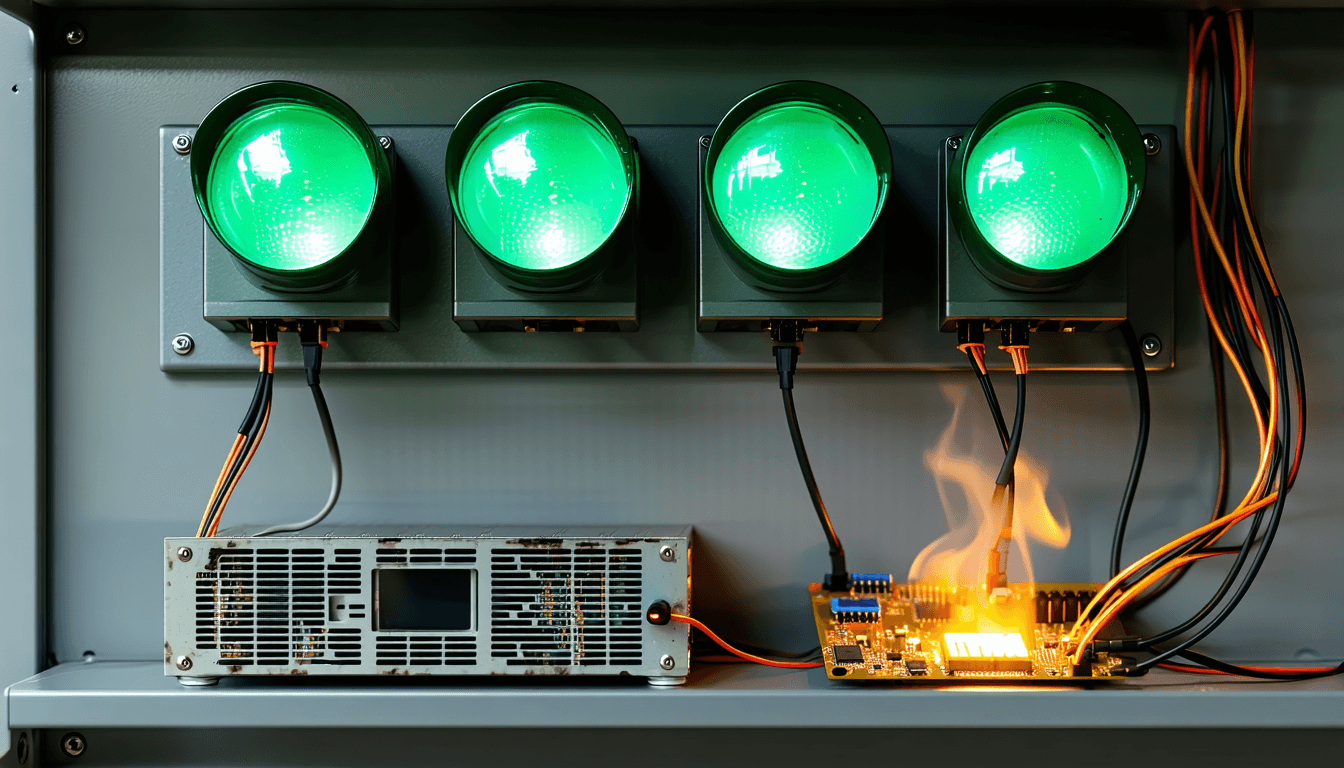
- What connects the two incidents is not a mechanism but that neither made anything report an error: Kubernetes said Running, ArgoCD said Synced and Healthy, Helm exited zero, and an admission policy checked for vulnerabilities and passed. Every layer answered the only question it knew how to ask, answered it correctly, and the composite answer was wrong.
- The first alert was IO PSI full above 15 percent for two minutes; /proc/pressure/io confirmed it with full avg10 at 24.97 and avg300 at 21.99, which mattered more because it meant a plateau rather than a spike already passed.
- vmstat showed bi around 90,000 blocks a second, bo essentially zero, and wa over 20 percent of CPU; the disk was at 38 percent, so nothing was full.
Compiled by The EngineerSomething wrong?How this is made
Why it matters
On August 17 a single alert rule on a four-core ARM box fired twice in one day for two root causes with nothing in common [2]. What the two incidents shared was not a mechanism but an absence: neither made anything report an error, because Kubernetes said Running, ArgoCD said Synced and Healthy, Helm exited zero, and an admission policy checked for vulnerabilities and passed [3].
The rules were new, added two days after an earlier incident: seven of them, covering PSI, swap consumption, D-state counts and a forecast on the memory trend [1]. They were built as insurance against a repeat and caught something else. The first firing was IO PSI full above 15 percent for two minutes, with /proc/pressure/io showing full avg10 at 24.97 and avg300 at 21.99, which the author reads as a plateau rather than a spike [4]. vmstat gave direction: bi around 90,000 blocks a second, bo essentially zero, wa over 20 percent of CPU, disk only 38 percent full [5].
The obvious suspect was a trap. A two-second delta scan of /proc/*/io under sudo returned one process well ahead of the rest, all-in-one-linux, PID 713618, reading about 93 MB/s [6]. That process had no files open: /proc/713618/fd held only sockets, and its maps showed a single file mapping, its own executable [7]. Its counters explain why. rchar was 18,033,040 bytes and read_bytes 63,512,895,488, with write_bytes zero [8], a ratio of roughly 3,500 to one [2]. rchar is what a process asks for through read(); read_bytes is what the block layer fetched on its behalf, and a gap that size means the IO was its own evicted pages being faulted back in, billed to a process that never initiated it [9].
The scope was host-wide: workingset_refault_file at 31.4 million, pgscan_file at 118 million, pgsteal_file at 91.6 million [10]. dmesg showed three OOM kills in sixteen hours, a JVM, a trivy scan job, and at 05:39 a process named all-in-one-linu, whose etime of 07:25:53 dated the heaviest reader on the box to that kill [11]. It was Jaeger in a demo namespace, container limit 128Mi, anon-rss at kill time 126,032 kB [12], about 96 percent of its own ceiling [1]. The node had memory requests at 41 percent of capacity and limits at 110 percent, and the scheduler reads requests, so it kept placing pods [13] against a limit total roughly 2.7 times the requests it was actually scoring [3].
Through all three kills the pod phase stayed Running, because the kubelet restarts the container in place, and kubectl get pods showed a restart count of 1 [14]. The box's own inspector, fifteen shell checks running at 09:00 and 21:00, would not have caught it either [15]: the evicted-pods check filters on status.phase=Failed, which an OOM-killed container never reaches [16], and the restart-storm check looks only at compose containers on the host with a threshold of ten [17]. The Grafana rules saw the stall and did their job, but aggregate pressure cannot name the container the kernel shot [18].
Two things to watch. First, whether requests-versus-limits drift gets its own alert, since that ratio, not any pod status, was the precondition for all three kills [13]. Second, the second incident: the account as supplied names the layers that stayed green across both [3] but breaks off before that cause is dissected.