Build1 distinct publisher2 min readUpdated
Circana has US console units down 39% in July and the average price paid up 16%. The platform splits say the price rises are still being absorbed, not refused.
The Engineer · Build desk
Compiled by The EngineerSomething wrong?How this is made
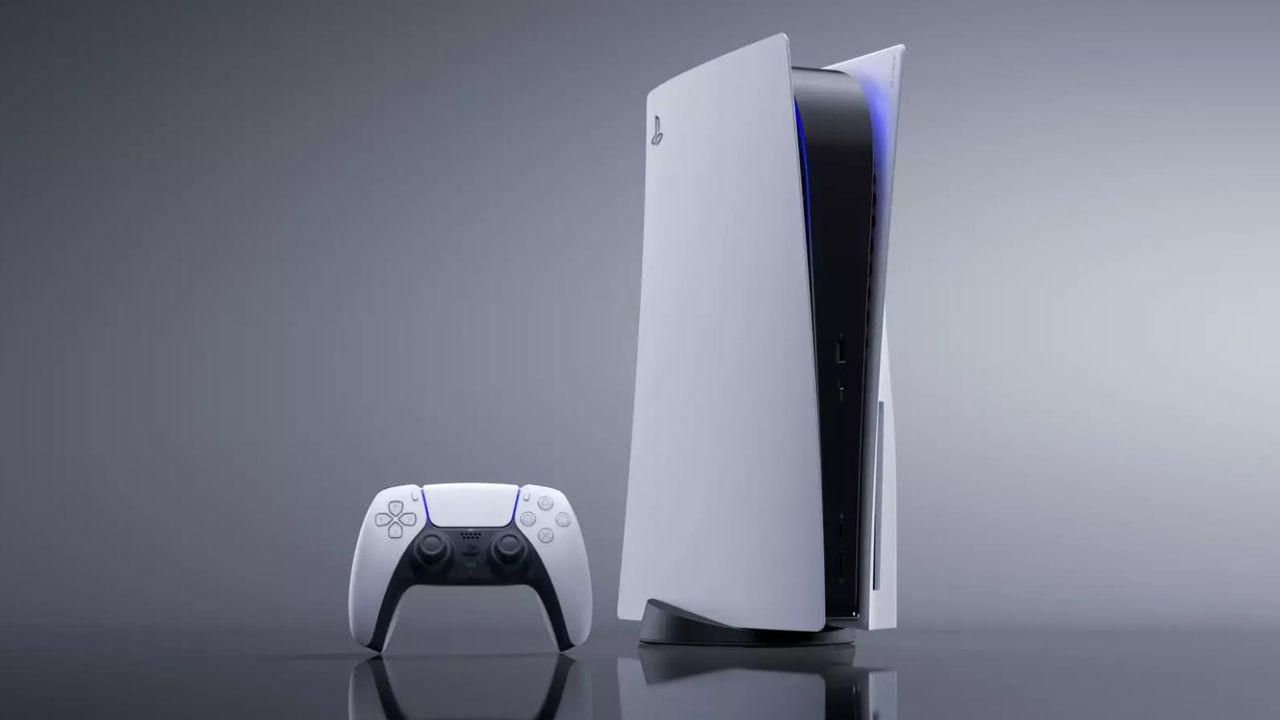
Sony's line is the one worth doing arithmetic on. PS5 dollars rose 29% while PS5 units fell 6% [5][3], which puts revenue per console sold up about 37% [1]. The $100 Sony added across the range in April was a 20% increase on the standard machine's previous $499 [6][2], so the other 17 points came from somewhere else: buyers moving up toward the $899 Pro [6], or discounting that used to happen and no longer does. Six percent fewer boxes for 37% more money each is an implied elasticity of about -0.16 [3]. That is a price increase being paid, not refused.
Microsoft's line reads the other way. Xbox Series dollars fell 18% and units fell 18% [9][3], so revenue per Xbox sold did not move at all [13], even though prices went up on every model and the 2TB Series X was dropped [9]. Higher list prices, the dearest SKU withdrawn, and the same average take per unit: buyers went down the range as fast as the prices went up.
The 39% belongs mostly to Nintendo, and not to Nintendo's pricing. Switch 2 led July on unit volume [7] and fell 51% [3], measured against the record June 2025 launch that Piscatella flagged as a skewed comparison, with the console still 11% ahead of the original Switch on a time-aligned basis [8]. Dividing the two headline numbers gives an implied aggregate elasticity of -2.4 [4]. Treat that as a ceiling rather than a measurement, because the largest single unit contributor shrank for calendar reasons.
What the month actually cost is easier to pin down. The average console changed hands for roughly $75 more than a year earlier [5][6]. Across the roughly 520,000 sold [12], that premium collected something like $39 million [9], while about $115 million left hardware altogether [7][8]. Hardware was around 6% of US game spending in the month [12] and around 23% of the decline in it [10][11], which is the ratio to watch: a small line item doing a quarter of the damage.
Nintendo shows how early this is. Its RAM costs for Switch 2 rose 41% late last year, and it reportedly cut planned output by 2 million units in March [11]. The supply side was adjusted months before the retail price was. Meanwhile the visible part of the market keeps narrowing: Xbox holds a little over 4% of US physical game spending this year against Nintendo's 63% and PlayStation's 32% [14], and Sony stops making discs for new games in January 2028 [15].
Follow any of these and your For You feed starts watching them — no settings page required.
Ranked by verification strength, evidence, and original report placement.
US console hardware sales fell 39% by unit volume in July against a year earlier, while the average price paid for a new system rose 16% to $542, according to Circana data posted by analyst Mat Piscatella on August 20.
PS5 dollar sales rose 29% in July even as unit sales fell 6%.
Sony's $100 increase across the PS5 range in April took the standard console to $599 and the PS5 Pro to $899.
Xbox Series dollar sales fell 18%, matching its unit decline, after Microsoft raised prices on every Xbox model for the third time in two years and dropped the 2TB Series X.
Total US video game spending across content, hardware and accessories fell 10% to $4.5 billion in July.
US console hardware dollar sales came in at $282 million in July, down 29% and the lowest July total since 2020, with Piscatella tying the drop to console price increases caused by the RAM and component crisis, a link Circana had not made in its monthly reporting before.
Evidence-backed comparisons of source perspectives and observed adoption signals. Read the methodology
Which Builder, Operator, and Investor concerns the observed source mix emphasized—not a truth score.
Evidence, demonstrated adoption, hype gap, incentives, and confidence are assessed independently, each on its own current evidence. How these are measured.
Specific third-party market data, but relayed by a single publisher
Every figure traces to one named measurement firm (Circana) via a named analyst's August 20 post, plus Circana's full report as cited by Kotaku for the physical-disc total, and the numbers are concrete and internally consistent across units, dollars and average price. Against that, the cluster contains one publisher, no direct link to the primary Circana report, several load-bearing quantities (implied 520,000 units, the ~$115 million revenue loss, elasticities) are arithmetic rather than measured, and the source itself notes that digital measurement has degraded to estimation for Microsoft and EA titles.
Real market-wide transaction data across all three platforms
This is not a pre-adoption announcement: the story reports actual US retail outcomes for July across PS5, Xbox Series and Switch 2, together with three concrete pricing actions (Sony's April $100 rise, Microsoft's third Xbox increase, Nintendo's announced September 1 move to $499) and category totals of $282 million hardware and $4.5 billion overall. Adoption of the price increases is partial rather than complete — Nintendo's rise had not taken effect at the time of reporting, so one platform's demand response is still unobserved.
Headline collapse framing overstates a mix-driven quarter
The 39% unit drop and 'plunge' framing read as a demand refusal, but the same data show PS5 dollars up 29%, Sony leading revenue, Xbox revenue per unit flat, and the largest single decline (Switch 2, -51%) measured against a record June 2025 launch while still tracking 11% ahead of the original Switch. The derived aggregate elasticity of about -2.4 inherits that launch distortion. The overstatement is modest rather than severe because the source carries the analyst's caveat itself and the dollar decline to a post-2020 low is real.
Vendor cost narratives and a shrinking measurement panel
Platform holders have a direct interest in attributing consumer price rises to upstream memory costs, and the story leans on vendor-side statements to that effect — Microsoft's Xbox CEO on paying five times more for memory and storage by 2027, and Nintendo's 41% RAM cost rise. At the same time Microsoft has removed itself from Circana's digital panel and EA left after going private, both moves that reduce external visibility into their performance. The analyst and publisher also have visibility incentives around a dramatic headline number. These are visible in the text rather than speculative, but the source does not interrogate any of them.
Moderate: solid primary numbers, thin sourcing and unresolved attribution
Confidence is supported by precise, mutually consistent figures from an established measurement firm and by three verifiable pricing actions. It is held down by single-publisher sourcing, indirect access to the primary report, reliance on derived arithmetic for the most quotable conclusions, the launch-comp distortion in the largest decline, and the fact that causation between memory costs and consumer demand is asserted by interested parties rather than demonstrated.
product
Every Console Now Costs More Than At Launch, And US Hardware Spend Fell 29%1 distinct publisher
leadership
The greenlight moved: where games leadership capacity is actually accumulating1 distinct publisher
build
C2PA proves who signed, not what was true: Content Credentials are provenance, not AI detection1 distinct publisher
product
Rillet's $100M reads as proof mid-market ERP is rip-and-replace, mostly at the cheap end1 distinct publisher
Distinct publishers with included, body-backed reporting in this cluster.