Science1 publisher3 min readPublished
University of Rhode Island publishes six decades of surveys from eight beaches online
University of Rhode Island opened its survey record of eight state beaches, begun in 1962, to the public on a new website. Coastal managers can now test storm effects against six decades of profiles, though the survey switched instruments around 2023.
The Scientist · Science desk
What happened
- The University of Rhode Island launched Rhode Island Beach Dynamics Over Decades, a public website holding one of the world's longest-running beach survey records.
- Students and scientists from URI and Eastern Connecticut State University have surveyed the shorelines of eight Rhode Island beaches since 1962.
- A storm page on the site shows how Hurricane Sandy's high water and waves changed Rhode Island beaches and dunes in 2012, even though the storm never hit the state directly.
Compiled by The ScientistSomething wrong?How this is made
Why it matters
- capability Anyone judging a storm's damage at these eight beaches can now set it against a public baseline that starts in 1962.
- constraint Any trend across the full record crosses an instrument change after about 61 years of level-and-rod data, and URI has not published how the two methods were matched.
- constraint With only eight beaches in the record, planners working on any other stretch of the Rhode Island coast can use it only for comparison, not as a measurement of their site.
A beach profile is a line of elevation points surveyed across the sand, from the waterline back to the landward vegetation. The points are plotted to show the beach's shape on one day [5]. Survey the same line again later and the difference between the two profiles is measured change. Multiply the cross-shore area by an alongshore distance and you get a volume of sand [6]. URI's record is that exercise repeated at eight beaches since 1962 by about four dozen students and several scientists [2].
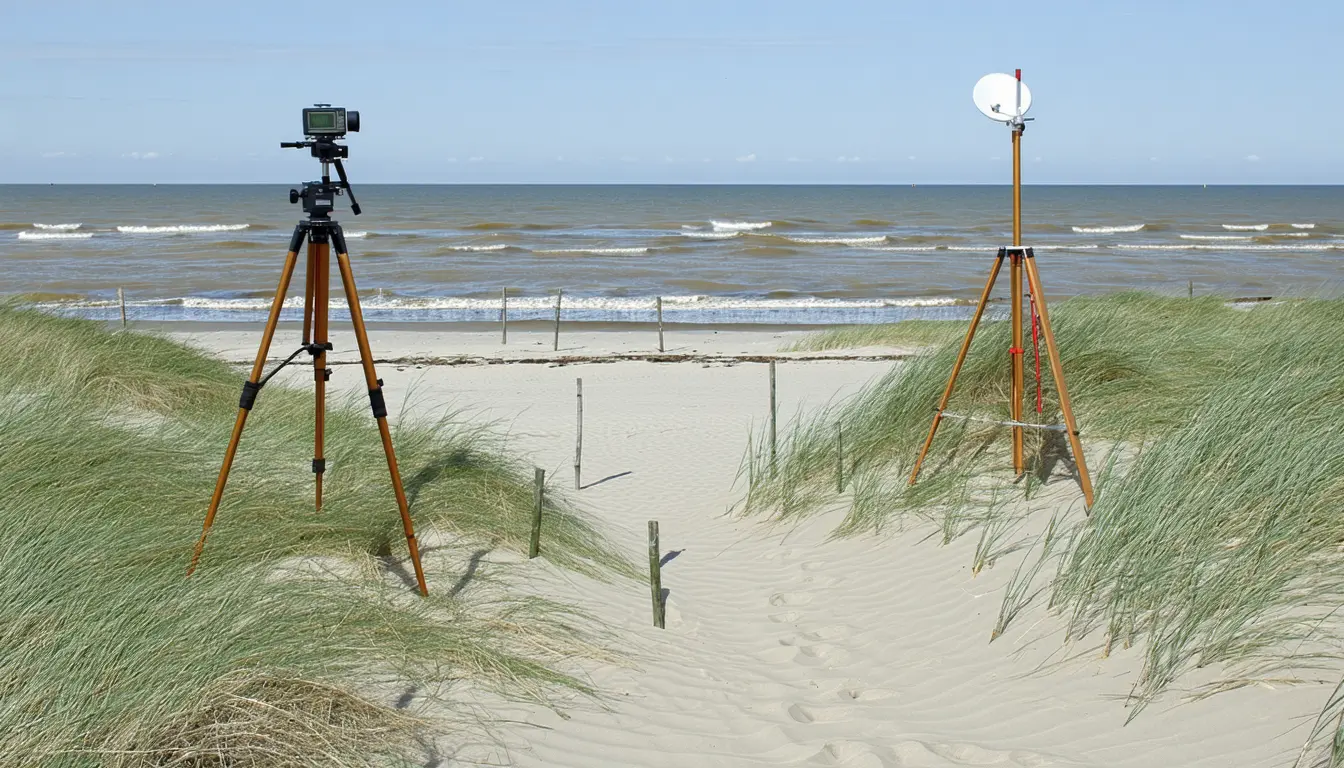
For most of that time the work took two people. One looked through a tripod-mounted survey level at the other, who held a stadia rod, to read height above the ground and distance to the rod. The method was slow and needed careful coordination [7]. Around 2023 the survey moved to real-time kinematic GPS. An antenna collects time signals from satellites while a controller pulls corrections in real time from an online network of base stations [8]. Subtracting 1962 from 2023, roughly 61 years of the record rest on the level and rod [1].
I would look at that handover first. Suppose the GPS and the level read slightly differently at the same spot. That offset would show up as change in the beach unless the two methods were tied together, for instance by running both side by side for a season. URI says the measurements reveal short- and long-term changes [13]. The release does not give an erosion or volume rate for any of the eight beaches, a survey count per beach, or an account of how the old and new instruments were reconciled.
Storms are the cleaner use. The site has a page on hurricanes and winter storms, and its example is Hurricane Sandy in 2012 [9]. Sandy did not strike Rhode Island directly. According to URI, it still brought high water and large waves that caused significant beach and dune changes [9]. The storm came 11 years before the switch to GPS [2], so a comparison of profiles taken around it stays within one instrument.
J.P. Walsh, a URI professor of oceanography who has supervised the survey since 2020, built the site with Mary Klimasewiski, a marine research associate at the Graduate School of Oceanography [4][12]. It took a year and a half [3]. "We're excited to bring decades of beach survey data together in a publicly accessible resource, making it easier for managers, researchers and the public to visualize and understand how our coastline is changing over time," said Klimasewiski [10].
Walsh pitched it at planning. "Like snowflakes, beaches never look the same again, and it's important for communities to appreciate and plan for these transformations," he said [15]. He also said: "The results they have generated can serve as a permanent record of the dynamism and disappearance of the Ocean State coastline" [11].
I think the record gives planners the most on storm-by-storm questions at these eight beaches, where profiles taken with the same instrument bracket the event. A six-decade erosion trend is a separate claim. It holds only once the 2023 join is documented.
What to watch
- Whether URI documents how level-and-rod and GPS readings were matched at the 2023 handover, and whether the raw survey points can be downloaded.
- Whether the team publishes erosion or sand-volume rates for each of the eight beaches from the six-decade record.
- Whether Rhode Island coastal managers cite the record in dune, storm or shoreline planning decisions.